
A Shiny app is served by one (single-threaded blocking) process by Open Source Shiny Server. This causes a scalability issue because all requests are handled one by one in a queue. Recently the creator of Shiny introduced the promises package, which brings asynchronous programming capabilities to R. This is a remarkable step forward to web development in R.
In this post, it’ll be demonstrated how to implement the async feature of Shiny. Then its limitation will be discussed with an alternative app, which is built by JavaScript for the frontend and RServe for the backend.
Async Shiny and Its Limitation
Brief Intro to Promises
A basic idea of how the promises package works is that a (long running) process is passed to a forked process while it immediately returns a promise object. Then the result can be obtained once it’s finished (or failed) by handlers eg) onFulfilled and onRejected. The package also provides pipe operators (eg %...>%) for ease of use. Typically a promise object can be created with the future package. See this page for further details.
Shiny App
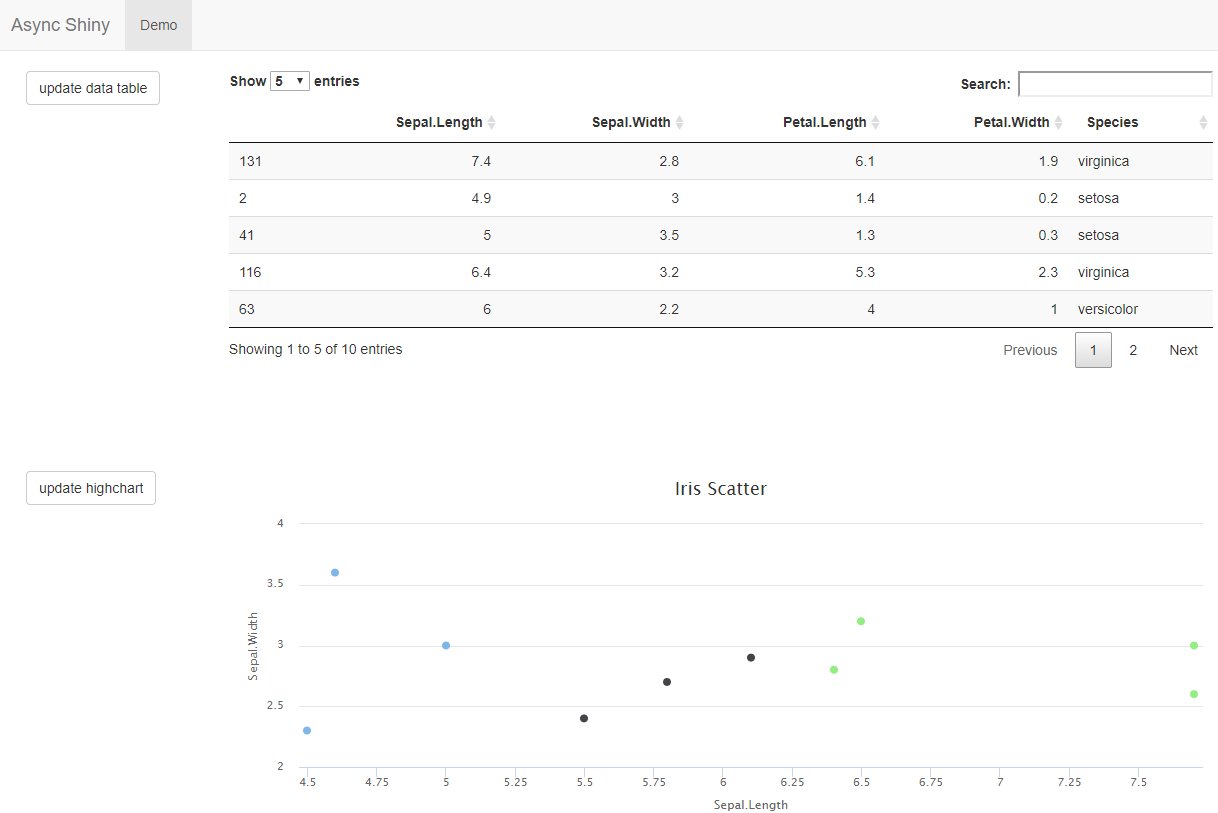
A simple Shiny app is created for demonstration that renders 3 htmlwidgets: DT, highcharter and plotly. For this, the following async-compatible packages are necessary.
- Shiny v1.1+
- DT from rstudio/DT@async
- htmlwidgets from ramnathv/htmlwidgets@async
- plotly from jcheng5/plotly@joe/feature/async
- highcharter - supported by htmlwidgets
At startup, it is necessary to allocate the number of workers (forked processes). Note it doesn’t necessarily be the same to the number of cores. Rather it may be better to set it higher if the machine has enough resource. This is because, if there are n workers and n+m requests, the m requests tend to be queued.
 1library(magrittr)
 2library(DT)
 3library(highcharter)
 4library(plotly)
 5
 6library(shiny)
 7
 8library(promises)
 9library(future)
10plan(multiprocess, workers = 100)
Then a simple NavBar page is created as the UI. A widget will be rendered by clicking a button.
 1tab <- tabPanel(
 2  title = 'Demo',
 3  fluidPage(
 4    fluidRow(
 5      div(
 6        style='height: 400px;',
 7        column(2, actionButton('dt', 'update data table')),
 8        column(10, dataTableOutput('dt_out'))
 9      )
10    ),
11    fluidRow(
12      div(
13        style='height: 400px;',
14        column(2, actionButton('highchart', 'update highchart')),
15        column(10, highchartOutput('highchart_out'))
16      )
17    ),
18    fluidRow(
19      div(
20        style='height: 400px;',
21        column(2, actionButton('plotly', 'update plotly')),
22        column(10, plotlyOutput('plotly_out'))
23      )
24
25    )
26  )
27)
28
29ui <- navbarPage("Async Shiny", tab)
A future object is created by get_iris(), which returns 10 records randomly from the iris data after 2 seconds. evantReactive()s generate htmlwidget objects and they are passed to the relevant render functions.
 1server <- function(input, output, session) {
 2
 3  get_iris <- function() {
 4    future({ Sys.sleep(2); iris[sample(1:nrow(iris), 10),] })
 5  }
 6
 7  dt_df <- eventReactive(input$dt, {
 8    get_iris() %...>%
 9      datatable(options = list(
10        pageLength = 5,
11        lengthMenu = c(5, 10)
12      ))
13  })
14
15  highchart_df <- eventReactive(input$highchart, {
16    get_iris()
17  })
18
19  plotly_df <- eventReactive(input$plotly, {
20    get_iris()
21  })
22
23  output$dt_out <- renderDataTable(dt_df())
24
25  output$highchart_out <- renderHighchart({
26    highchart_df() %...>%
27      hchart('scatter', hcaes(x = 'Sepal.Length', y = 'Sepal.Width', group = 'Species')) %...>%
28      hc_title(text = 'Iris Scatter')
29  })
30
31  output$plotly_out <- renderPlotly({
32    plotly_df() %...>%
33      plot_ly(x = ~Sepal.Length, y = ~Sepal.Width, z = ~Petal.Length, color = ~Species)
34  })
35}
The app code can also be found in this GitHub repository.
For deployment, a Docker image is created that includes the async-compatible packages, Open Source Shiny Server and RServe. It is available as rockerextra/shiny-async-dev:3.4 and its Dockerfile can be found in this repo. The app can be deployed with Docker Compose as can be seen here.
A screen shot of the Shiny app is seen below. It is possible to check the async feature by opening the app in 2 different browsers and hit buttons multiple times across.
Limitation
You may notice the htmlwidgets are rendered without delay across browsers but it’s not the case in the same browser. This is due to the way how Shiny’s flush cycle is implemented. Simply put, a user (or session) is not affected by other users (or sessions) for their async requests. However the async feature of Shiny is of little help for multiple async requests by a single user because all requests are processed one by one as its sync version.
This limitation can have a significant impact on developing a web application. In general, almost all events/actions are handled through the server in a Shiny app. However the async feature of the server is not the full extent that a typical JavaScript app can bring.
Alternative Implementation
In order to compare the async Shiny app to a typical web app, an app is created with JavaScript for the frontend and RServe for the backend. In the UI, JQuery will be used for AJAX requests by clicking buttons. Then the same htmlwidget elements will be rendered to the app. With this setup, it’s possible to make multiple requests concurrently in a session and they are all handled asynchronously by a JavaScript-backed app.
RServe Backend
So as to render htmlwidgets to UI, it is necessary to have a backend API. As discussed in API Development with R series (Part I, Part II), RServe can be a performant option for building an API.
I don’t plan to use native JavaScript libraries for creating individual widgets. Rather I’m going to render widgets that are created by R. Therefore it is necessary to understand the structure of a widget. saveWidget() of the htmlwidgets package helps save a widget into a HTML file and it executes save_html() of the htmltools package.
Key parts of a widget is
- head - dependent JavaScript and CSS
- body
- div - widget container and element
- script - application/json for widget data
- script - application/htmlwidget-sizing for widget size
For example,
 1<!DOCTYPE html>
 2<html>
 3  <head>
 4  <meta charset='utf-8'/>
 5  <script src="src-to/htmlwidgets.js"></script>
 6  <script src="src-to/jquery.min.js"></script>
 7  <script src="src-to/datatables.js"></script>
 8  ... more DT dependencies
 9  </head>
10  <body>
11  <div id="htmlwidget_container">
12    <div id="htmlwidget"
13        style="width:960px;height:500px;"
14        class="datatables html-widget">
15    </div>
16  </div>
17  <script type="application/json"
18          data-for="htmlwidget">JSON DATA</script>
19  <script type="application/htmlwidget-sizing"
20          data-for="htmlwidget">SIGING INFO</script>
21  </body>
22</html>
write_widget() is a slight modification of saveWidget() and save_html(). Given the following arguments, it returns the necessary widget string (HTML or JSON) and it can be passed to the UI. In this post, src type will be used exclusively.
- w
- htmlwidget object
- see
widget()illustrated below
- element_id
- DOM element id (eg dt_out)
- type
- json - JSON DATA only
- src - application/json script
- html - body elements
- all - entire html page
 1library(htmlwidgets)
 2
 3write_widget <- function(w, element_id, type = NULL,
 4                          cdn = NULL, output_path = NULL) {
 5  w$elementId <- sprintf('htmlwidget_%s', element_id)
 6  toHTML <- utils::getFromNamespace(x = 'toHTML', ns = 'htmlwidgets')
 7  html <- toHTML(w, standalone = TRUE, knitrOptions = list())
 8
 9  type <- match.arg(type, c('src', 'json', 'html', 'all'))
10  if (type == 'src') {
11    out <- html[[2]]
12  } else if (type == 'json') {
13    bptn <- paste0('<script type="application/json" data-for="htmlwidget_',
14              element_id, '">')
15    eptn <- '</script>'
16    out <- sub(eptn, '', sub(bptn, '', html[[2]]))
17  } else {
18    html_tags <- htmltools::renderTags(html)
19    html_tags$html <- sub('htmlwidget_container',
20                  sprintf('htmlwidget_container_%s', element_id) ,
21                  html_tags$html)
22    if (type == 'html') {
23      out <- html_tags$html
24    } else { # all
25      libdir <- gsub('\\\\', '/', tempdir())
26      libdir <- gsub('[[:space:]]|[A-Z]:', '', libdir)
27
28      deps <- lapply(html_tags$dependencies, update_dep_path, libdir = libdir)
29      deps <- htmltools::renderDependencies(dependencies = deps,
30                                            srcType = c('hred', 'file'))
31      deps <- ifelse(!is.null(cdn), gsub(libdir, cdn, deps), deps)
32
33      out <- c(
34        "<!DOCTYPE html>",
35        "<html>",
36        "<head>",
37        "<meta charset='utf-8'/>",
38        deps,
39        html_tags$head,
40        "</head>",
41        "<body>",
42        html_tags$html,
43        "</body>",
44        "</html>")
45    }
46  }
47
48  if (!is.null(output_path)) {
49    writeLines(out, output_path, useBytes = TRUE)
50  } else {
51    paste(out, collapse = '')
52  }
53}
54
55update_dep_path <- function(dep, libdir = 'lib') {
56  dir <- dep$src$file
57  if (!is.null(dep$package))
58    dir <- system.file(dir, package = dep$package)
59
60  if (length(libdir) != 1 || libdir %in% c("", "/"))
61    stop("libdir must be of length 1 and cannot be '' or '/'")
62
63  target <- if (getOption('htmltools.dir.version', TRUE)) {
64    paste(dep$name, dep$version, sep = '-')
65  } else {
66    dep$name
67  }
68  dep$src$file <- file.path(libdir, target)
69  dep
70}
Essentially the API has 2 endpoints.
- widget
- returns output from
write_widget()given element_id and type
- returns output from
- hdata
- returns iris data as JSON
 1widget <- function(element_id, type, get_all = FALSE, cdn = 'public', ...) {
 2  dat <- get_iris(get_all)
 3  if (grepl('dt', element_id)) {
 4    w <- dat %>%
 5      datatable(options = list(
 6        pageLength = 5,
 7        lengthMenu = c(5, 10)
 8      ))
 9  } else if (grepl('highchart', element_id)) {
10    w <- dat %>%
11      hchart('scatter', hcaes(x = 'Sepal.Length', y = 'Sepal.Width', group = 'Species')) %>%
12      hc_title(text = 'Iris Scatter')
13  } else if (grepl('plotly', element_id)) {
14    w <- dat %>%
15      plot_ly(x = ~Sepal.Length, y = ~Sepal.Width, z = ~Petal.Length, color = ~Species)
16  } else {
17    stop('Unexpected element')
18  }
19  write_widget(w, element_id, type, cdn)
20}
21
22hdata <- function() {
23  dat <- get_iris(TRUE)
24  names(dat) <- sub('\\.', '', names(dat))
25  dat %>% toJSON()
26
27}
28
29get_iris <- function(get_all = FALSE) {
30  Sys.sleep(2)
31  if (!get_all) {
32    iris[sample(1:nrow(iris), 10),]
33  } else {
34    iris
35  }
36}
process_request() remains largely the same but needs some modification so that it can be used as a backend of a web app.
- Cross-Origin Resource Sharing (CORS)
- requests from browser will fail without necessary headers and handling OPTIONS method
- Response content type
- depending on type, response content type will be either application/json or text/html
See API Development with R series (Part I, Part II) for further details of process_request() and how RServe’s built-in HTTP server works.
 1process_request <- function(url, query, body, headers) {
 2  #### building request object
 3  request <- list(uri = url, method = 'POST', query = query, body = body)
 4
 5  ## parse headers
 6  request$headers <- parse_headers(headers)
 7  if ("request-method" %in% names(request$headers))
 8    request$method <- c(request$headers["request-method"])
 9
10  set_headers <- function(...) {
11    paste(list(...), collapse = '\r\n')
12  }
13
14  h1 <- 'Access-Control-Allow-Headers: Content-Type'
15  h2 <- 'Access-Control-Allow-Methods: POST,GET,OPTIONS'
16  h3 <- 'Access-Control-Allow-Origin: *'
17
18  cors_headers <- set_headers(h1, h2, h3)
19
20  if (request$method == 'OPTIONS') {
21    return (list('', 'text/plain', cors_headers))
22  }
23
24  request$pars <- list()
25  if (request$method == 'POST') {
26    if (!is.null(body)) {
27      if (is.raw(body))
28        body <- rawToChar(body)
29      if (any(grepl('application/json', request$headers)))
30        body <- jsonlite::fromJSON(body)
31      request$pars <- as.list(body)
32    }
33  } else {
34    if (!is.null(query)) {
35      request$pars <- as.list(query)
36    }
37  }
38
39  if ('type' %in% names(request$pars)) {
40    if (request$pars$type == 'json') {
41      content_type <- 'application/json; charset=utf-8'
42    } else {
43      content_type <- 'text/html; charset=utf-8'
44    }
45  } else {
46    content_type <- 'text/plain; charset=utf-8'
47  }
48
49  message(sprintf('Header:\n%s', cors_headers))
50  message(sprintf('Content Type: %s', content_type))
51  message('Params:')
52  print(do.call(c, request$pars))
53
54  #### building output object
55  matched_fun <- gsub('^/', '', request$uri)
56
57  payload <- tryCatch({
58    do.call(matched_fun, request$pars)
59  }, error = function(err) {
60    'Internal Server Error'
61  })
62
63  return (list(payload, content_type, cors_headers))
64}
The source can be found in here and the API deployment is included in the docker compose.
JavaScript Frontend
The app will be kept in index.html and will be served by a simple python web server. Basically the same Bootstrap page is created.
It is important to keep all the widgets’ dependent JavaScript and CSS in head. We have 3 htmlwidgets and they are wrapped by the htmlwidgets package. Therefore it depends on
- htmlwidgets
- DataTables for DT
- Highcharts for highcharter
- Plotly for plotly
- CrossTalk for DT and plotly
- Bootstrap for layout
- JQuery for all
Note that a htmlwidget package tends to rely on a specific JQuery library. For example, the DT package uses 1.12.4 while the highcharter uses 1.11.1. Therefore there is a chance to encounter version incompatibility if multiple htmlwidget packages rendered at the same time. The HTML source of Shiny can be helpful because it holds a JQuery lib that can be shared across all widget packages.
 1<head>
 2  <meta charset='utf-8'/>
 3  <!-- necessary to control htmlwidgets -->
 4  <script src="/public/htmlwidgets/htmlwidgets.js"></script>
 5  <!-- need a shared JQuery lib -->
 6  <script src="/public/shared/jquery.min.js"></script>
 7  <!-- DT -->
 8  <script src="/public/datatables/datatables.js"></script>
 9  ... more DT dependencies
10  <!-- highchater -->
11  <script src="/public/highcharter/lib/proj4js/proj4.js"></script>
12  ... more highcharts dependencies
13  <script src="/public/highcharter/highchart.js"></script>
14  <!-- plotly -->
15  <script src="/public/plotly/plotly.js"></script>
16  ... more plotly dependencies
17  <!-- crosstalk -->
18  <script src="/public/crosstalk/js/crosstalk.min.js"></script>
19  ... more crosstalk depencencies
20  <!-- bootstrap, etc -->
21  <script src="/public/shared/bootstrap/js/bootstrap.min.js"></script>
22  ... more bootstrap, etc depencencies
23</head>
The widget containers/elements as well as sizing script are added in body. The naming rules for the container and element are
- container - htmlwidget_container_[element_id]
- element - htmlwidget_[element_id]
In this structure, widgets can be updated if their data (application/json script) is added/updated to the page.
 1<body>
 2  ... NAV
 3  <div class="container-fluid">
 4    ... TAB
 5    <div class="container-fluid">
 6      <div class="row">
 7        <div style="height: 400px;">
 8          <div class="col-sm-2">
 9            <button id="dt" type="button"
10                    class="btn btn-default action-button">
11              update data table
12            </button>
13          </div>
14          <div class="col-sm-10">
15              <div id="htmlwidget_container_dt_out">
16                <div id="htmlwidget_dt_out"
17                    style="width:100%;height:100%;"
18                    class="datatables html-widget">
19                </div>
20              </div>
21          </div>
22        </div>
23      </div>
24      ... highcharter wrapper
25      ... plotly wrapper
26    </div>
27
28  </div>
29
30<script type="application/htmlwidget-sizing"
31        data-for="htmlwidget_dt_out">
32  {"browser":{"width":"100%","height":400,"padding":40,"fill":true}}
33</script>
34... hicharter sizing
35... plotly sizing
As mentioned earlier, AJAX requests are made by clicking buttons and it’s implemented in req(). Key steps are
- remove html-widget-static-bound class from a widget
- makes a call with element_id and type=src
- note to change hostname
- append or replace application/json script
- for plotly,
purge()chart. Otherwise traces added continuously
- for plotly,
- execute
window.HTMLWidgets.staticRender()
 1<script type = "text/javascript" language = "javascript">
 2    function req(elem, tpe) {
 3     var btn_id = "#" + elem;
 4     var widget_id = "#htmlwidget_" + elem + "_out";
 5     var elem_id = elem + "_out";
 6     var data_for = "htmlwidget_" + elem + "_out";
 7     var scr_selector = 'script[type="application/json"][data-for="' +
 8                          data_for + '"]';
 9     $.support.cors = true;
10     $(btn_id).prop("disabled", true);
11     $(widget_id).removeClass("html-widget-static-bound");
12     $.ajax({
13       url: "http://[hostname]:8000/widget",
14       data: { element_id: elem_id, type: tpe },
15       error: function(err) {
16         $(btn_id).removeAttr('disabled');
17       },
18       success: function(data) {
19          //console.log(data)
20          if($(scr_selector).length == 0) {
21            $('body').append(data)
22          } else {
23            if (elem.includes('plotly')) {
24              try {
25                //Plotly.deleteTraces(htmlwidget_plotly_out, [0])
26                Plotly.purge(data_for);
27              }
28              catch(err) {
29                console.log(err);
30              }
31            }
32            $(scr_selector).replaceWith(data);
33          }
34          setTimeout(function(){
35            window.HTMLWidgets.staticRender();
36          }, 500);
37          $(btn_id).removeAttr('disabled');
38       }
39     });
40    }
41
42    $(document).ready(function() {
43      $("#dt").click(function() {
44        req('dt', 'src');
45      });
46    });
47
48    ... button clicks for highcharter and plotly
49</script>
For comparison, the async Shiny app and the JavaScript frontend/backend are included in the docker compose. The JavaScript app can be accessed in port 7000. Once started, it’s possible to see widgets are rendered without delay when buttons are clicked multiple times.
Compared to the async Shiny app, the JavaScript app is more effective in handling multiple requests. The downside of it is the benefits that Shiny provides are no longer available. Some of them are built-in data binding, event handling and state management. For example, think about what reactive*() and observe*() do for a Shiny app. Although it is possible to setup those with plain JavaScript or JQuery, life will be a lot easier if an app is built with one of the popular JavaScript frameworks: Angular, React and Vue. In the next post, it’ll be shown how to render htmlwidgets in a Vue application as well as building those with native JavaScript libraries.


Comments