
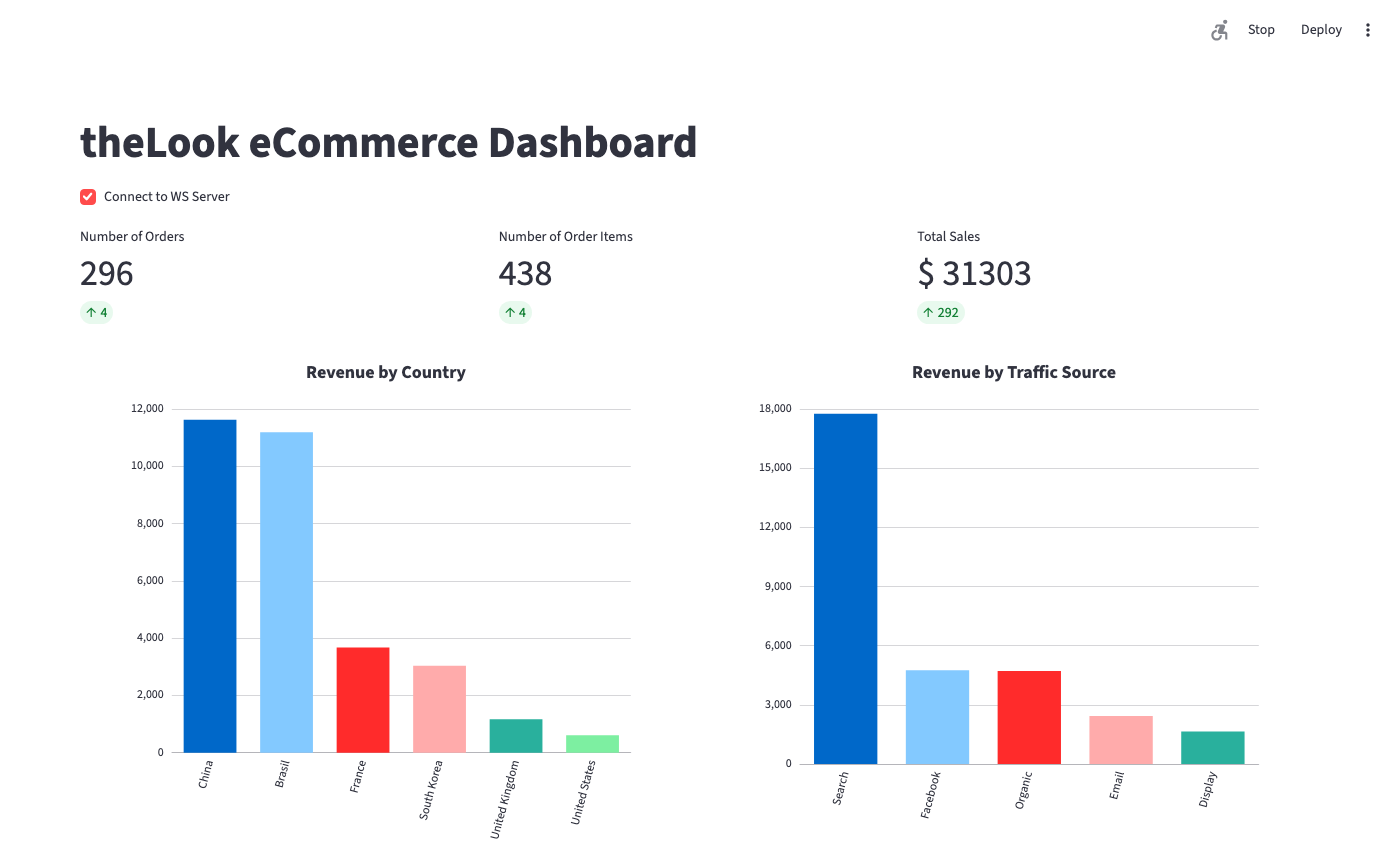
A real-time monitoring dashboard is developed using Streamlit, an open-source Python framework that allows data scientists and AI/ML engineers to create interactive data apps. The app connects to the WebSocket server we developed in Part 1 and continuously fetches data to visualize key metrics such as order counts, sales data, and revenue by traffic source and country. With interactive bar charts and dynamic metrics, users can monitor sales trends and other important business KPIs in real-time.
Streamlit Frontend
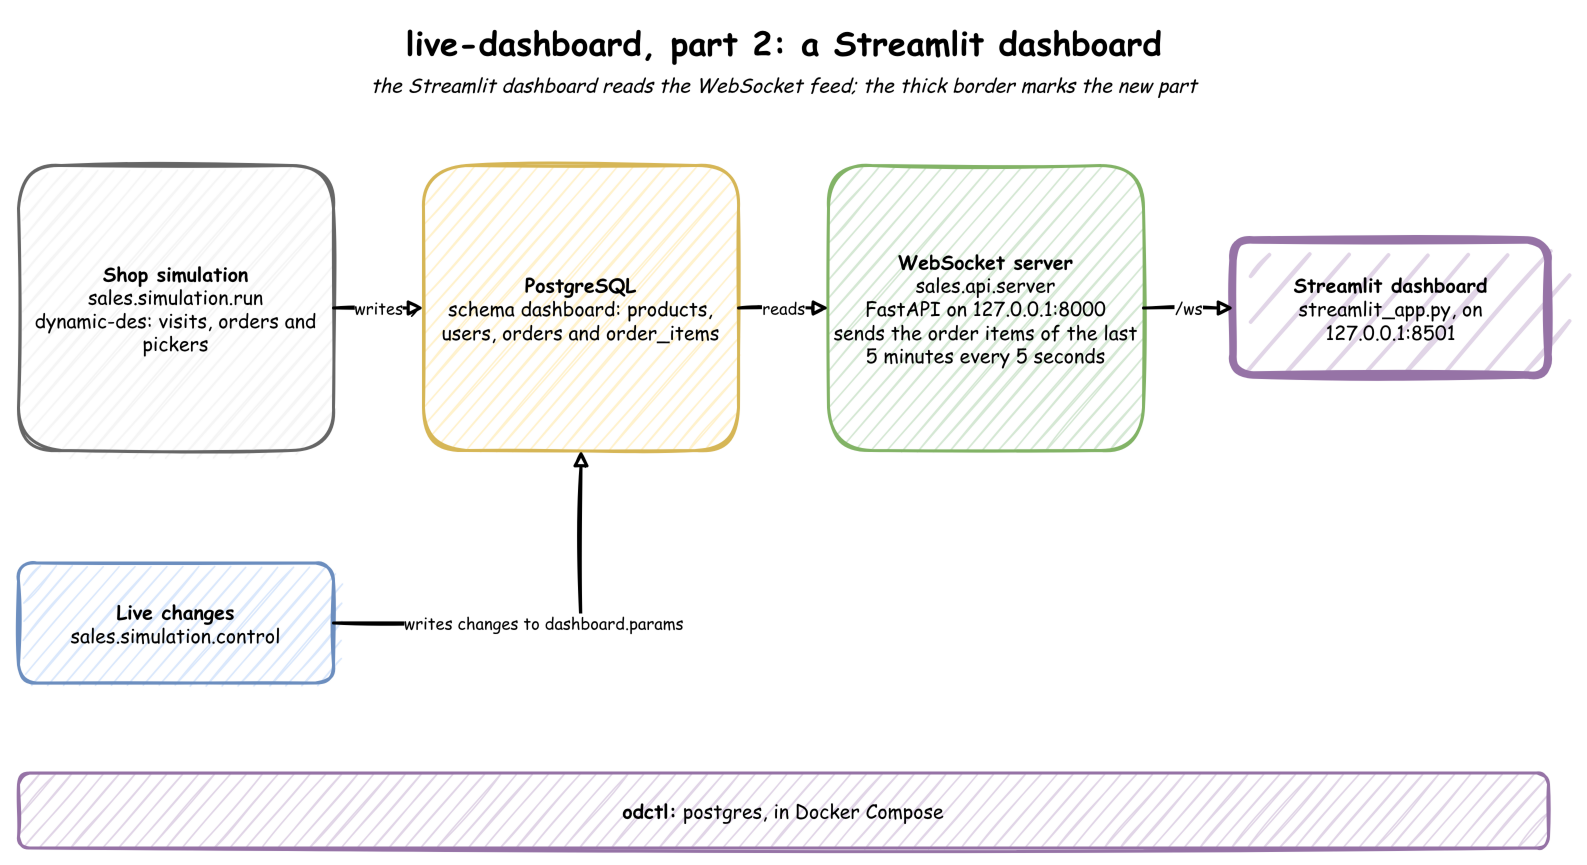
This Streamlit dashboard is designed to process and display real-time theLook eCommerce data using plain Python for data manipulation, Streamlit’s built-in metric component for KPIs, and Apache ECharts for visualizations. The source code for this post can be found in the live-dashboard folder of the benchtop GitHub repository. It is one of the Benchtop projects, which run locally from a fresh clone.
Components
The data processing logic is managed by functions in sales/dashboard/metrics.py, and the dashboard components are drawn by sales/dashboard/streamlit_app.py. Below are the details of those functions.
Calculating Metrics:
- The
metrics()function accepts a list of records, as the WebSocket server sends them. - Key metrics like the number of orders, number of order items, and total sales are calculated from the records and returned for display, with the total sales rounded to whole dollars.
- The
Generating Metrics:
- The
metric_cards()function creates a list of dictionaries containing metrics and their respective changes (delta), comparing the current and previous values of orders, order items, and total sales. - The
_draw()function instreamlit_app.pytakes the metric cards and displays them in Streamlit’s metric components within thecards_areacontainer. It uses a column layout to show the metrics side-by-side.
- The
Creating Chart Options:
- The
revenue_charts()function generates configuration data for bar charts that display revenue by country and revenue by traffic source. - It groups the records by country and traffic source, sums the sale_price for each, and sorts it in descending order.
- ECharts options are defined for each chart with titles and axis settings, and each bar takes its own colour. The charts are configured to show tooltips when hovering over the bars.
- The
Displaying Charts:
- The
_draw()function also takes the ECharts options and renders each chart within thecharts_areacontainer using thest_echartscomponent of the streamlit-echarts package. - Each chart is placed in its own column, with dynamic layout adjustments based on the number of charts being displayed. The charts are rendered with a fixed height of 500px.
- The
 1# live-dashboard/sales/dashboard/metrics.py
 2"""Turns the WebSocket's records into the dashboard's metric cards and chart options.
 3
 4The Next.js dashboard does the same in `nextjs/src/lib/processing.ts`.
 5"""
 6
 7from collections import defaultdict
 8
 9LABELS = {
10    "num_orders": "Number of Orders",
11    "num_order_items": "Number of Order Items",
12    "total_sales": "Total Sales",
13}
14CHARTS = {
15    "country": "Country",
16    "traffic_source": "Traffic Source",
17}  # revenue grouped by
18
19
20def metrics(records: list[dict]) -> dict[str, int]:
21    """
22    Counts the orders and order items, and adds up the sales.
23
24    Args:
25        records (list[dict]): The order items, from the WebSocket.
26
27    Returns:
28        dict[str, int]: `num_orders`, `num_order_items` and `total_sales`, in dollars.
29    """
30    return {
31        "num_orders": len({r["order_id"] for r in records}),
32        "num_order_items": len({r["item_id"] for r in records}),
33        "total_sales": round(sum(r["sale_price"] for r in records)),
34    }
35
36
37def metric_cards(current: dict[str, int], previous: dict[str, int]) -> list[dict]:
38    """
39    Builds the metric cards, each with its change since the last update.
40
41    Args:
42        current (dict[str, int]): The metrics now.
43        previous (dict[str, int]): The metrics at the last update.
44
45    Returns:
46        list[dict]: Each card's `label`, `value` and `delta`.
47    """
48    return [
49        {
50            "label": label,
51            "value": f"$ {current[k]}" if k == "total_sales" else current[k],
52            "delta": current[k] - previous[k],
53        }
54        for k, label in LABELS.items()
55    ]
56
57
58def revenue_charts(records: list[dict]) -> list[dict]:
59    """
60    Builds the ECharts options of revenue by country and by traffic source.
61
62    Args:
63        records (list[dict]): The order items, from the WebSocket.
64
65    Returns:
66        list[dict]: One bar chart's options per grouping, largest revenue first.
67    """
68    charts = []
69    for column, title in CHARTS.items():
70        revenue: dict[str, float] = defaultdict(float)
71        for r in records:
72            revenue[r[column]] += r["sale_price"]
73        bars = sorted(revenue.items(), key=lambda kv: kv[1], reverse=True)
74        charts.append(
75            {
76                "title": {"text": f"Revenue by {title}"},
77                "grid": {"containLabel": True},  # room for the rotated axis labels
78                "xAxis": {
79                    "type": "category",
80                    "data": [k for k, _ in bars],
81                    "axisLabel": {"rotate": 75},
82                },
83                "yAxis": {"type": "value"},
84                "series": [
85                    {
86                        "type": "bar",
87                        "colorBy": "data",
88                        "data": [round(v) for _, v in bars],
89                    }
90                ],
91                "tooltip": {"trigger": "axis", "axisPointer": {"type": "shadow"}},
92            }
93        )
94    return charts
Application
The dashboard connects to the WebSocket server to fetch and display real-time theLook eCommerce data. Here’s a detailed breakdown of its functionality:
WebSocket Connection:
- The
_follow()function is an asynchronous task that establishes a connection to a WebSocket server (ws://127.0.0.1:8000/ws) using an asynchronous HTTP client by the aiohttp package. It listens for incoming messages from the server, which contain the eCommerce data. - As each message is received, the function reads its list of records and computes key metrics using the
metrics()function.
- The
Generating and Displaying Metrics:
- The
metric_cards()function calculates and prepares key metrics (such as number of orders, order items, and total sales) along with the delta (changes) from the previous values. - The
_draw()function updates the Streamlit dashboard by displaying these metrics in thecards_area.
- The
Creating and Displaying Charts:
- The
revenue_charts()function processes the data and generates configuration options for bar charts, displaying revenue by country and traffic source. - The
_draw()function renders the charts in thecharts_areacontainer, using ECharts for interactive data visualizations.
- The
Real-time Updates:
- The loop continuously listens for new data from the WebSocket server. As data is received, it updates both the metrics and charts in real-time.
User Interface:
- The app sets a wide layout with the title “theLook eCommerce Dashboard”.
- A checkbox (
Connect to WS Server) lets the user choose whether to connect to the WebSocket server. When checked, the dashboard fetches data live and updates metrics and charts accordingly. - If the checkbox is unchecked, only the static metrics are displayed.
This setup provides a dynamic dashboard that pulls and visualizes real-time eCommerce data, making it interactive and responsive for monitoring sales and performance metrics.
 1# live-dashboard/sales/dashboard/streamlit_app.py
 2"""The Streamlit dashboard: metric cards and revenue charts, updated from the WebSocket.
 3
 4Run: python -m streamlit run sales/dashboard/streamlit_app.py
 5"""
 6
 7import asyncio
 8
 9import aiohttp
10import streamlit as st
11from streamlit_echarts import st_echarts
12
13from sales.core.config import WS_URL
14from sales.dashboard.metrics import LABELS, metric_cards, metrics, revenue_charts
15
16
17def _draw(cards: list[dict], charts: list[dict], cards_area, charts_area) -> None:
18    """Replaces the cards and charts on the page."""
19    with cards_area.container():
20        for col, card in zip(st.columns(len(cards)), cards):
21            col.metric(**card)
22    if not charts:  # before the first message
23        return
24    with charts_area.container():
25        for col, options in zip(st.columns(len(charts)), charts):
26            with col:
27                st_echarts(options=options, height="500px")
28
29
30async def _follow(cards_area, charts_area) -> None:
31    """Redraws the page for every message the WebSocket sends."""
32    previous = dict.fromkeys(LABELS, 0)
33    async with aiohttp.ClientSession() as session, session.ws_connect(WS_URL) as ws:
34        async for message in ws:
35            records = message.json()
36            current = metrics(records)
37            _draw(
38                metric_cards(current, previous),
39                revenue_charts(records),
40                cards_area,
41                charts_area,
42            )
43            previous = current
44
45
46st.set_page_config(page_title="theLook eCommerce", layout="wide")
47st.title("theLook eCommerce Dashboard")
48connect = st.checkbox("Connect to WS Server")
49cards_area, charts_area = st.empty(), st.empty()
50if connect:
51    asyncio.run(_follow(cards_area, charts_area))
52else:
53    _draw(metric_cards(*[dict.fromkeys(LABELS, 0)] * 2), [], cards_area, charts_area)
Deployment
Data Producer and WebSocket Server
As discussed in Part 1, PostgreSQL is started with odctl up postgres, and the data generator and WebSocket server are started with python -m sales.simulation.run and uvicorn sales.api.server:app --host 127.0.0.1 --port 8000, each in its own terminal. Once started, the server can be checked with the WebSocket client of the websockets package by executing python -m websockets ws://127.0.0.1:8000/ws, and its logs are printed in its terminal.
The client prints each message the server sends: a list of the order items of the last five minutes, here 39 records in the first message.
1python -m websockets ws://127.0.0.1:8000/ws
1Connected to ws://127.0.0.1:8000/ws.
2< [{"user_id":"427f5544-f594-4127-826e-912dc0dd970e","age":40,"gender":"M","country":"China","traffic_source":"Search","order_id":"e8c140bd-087a-4dfe-ac01-29f40a36a27e","item_id":"40deff28-0310-49ed-b11b-fdf0a3dabb24","category":"Active","cost":24.7,"item_status":"Shipped","sale_price":55.04,"created_at":"2026-09-30T13:57:06.948553+00:00"}, ...]
The server logs how many records it sends every five seconds:
1INFO:     Started server process [...]
2INFO:     Waiting for application startup.
3INFO:     Application startup complete.
4INFO:     Uvicorn running on http://127.0.0.1:8000 (Press CTRL+C to quit)
5INFO:     127.0.0.1:54478 - "WebSocket /ws" [accepted]
6INFO:     connection open
7INFO:     Sending 39 records
8INFO:     Sending 54 records
9INFO:     Sending 67 records
Frontend Dashboard
The dashboard can be started by running the Streamlit app as shown below. Once started, it can be accessed in a browser at http://127.0.0.1:8501.
 1## create and activate a virtual environment
 2# https://docs.astral.sh/uv/
 3$ uv venv
 4$ source .venv/bin/activate
 5
 6## install pip packages
 7(.venv) $ uv pip install -r requirements.txt
 8
 9## start the app
10(.venv) $ python -m streamlit run sales/dashboard/streamlit_app.py


Comments