
A real-time monitoring dashboard connects to the WebSocket server from Part 1 to continuously fetch and visualize key metrics such as order counts, sales data, and revenue by traffic source and country. With interactive bar charts and dynamic metrics, users can monitor sales trends and other critical business KPIs in real-time. In this post, we build it using Next.js, a React framework that supports server-side rendering, static site generation, and full-stack capabilities with built-in performance optimizations. It is similar to the Streamlit app we developed in Part 2.
Next.js Frontend
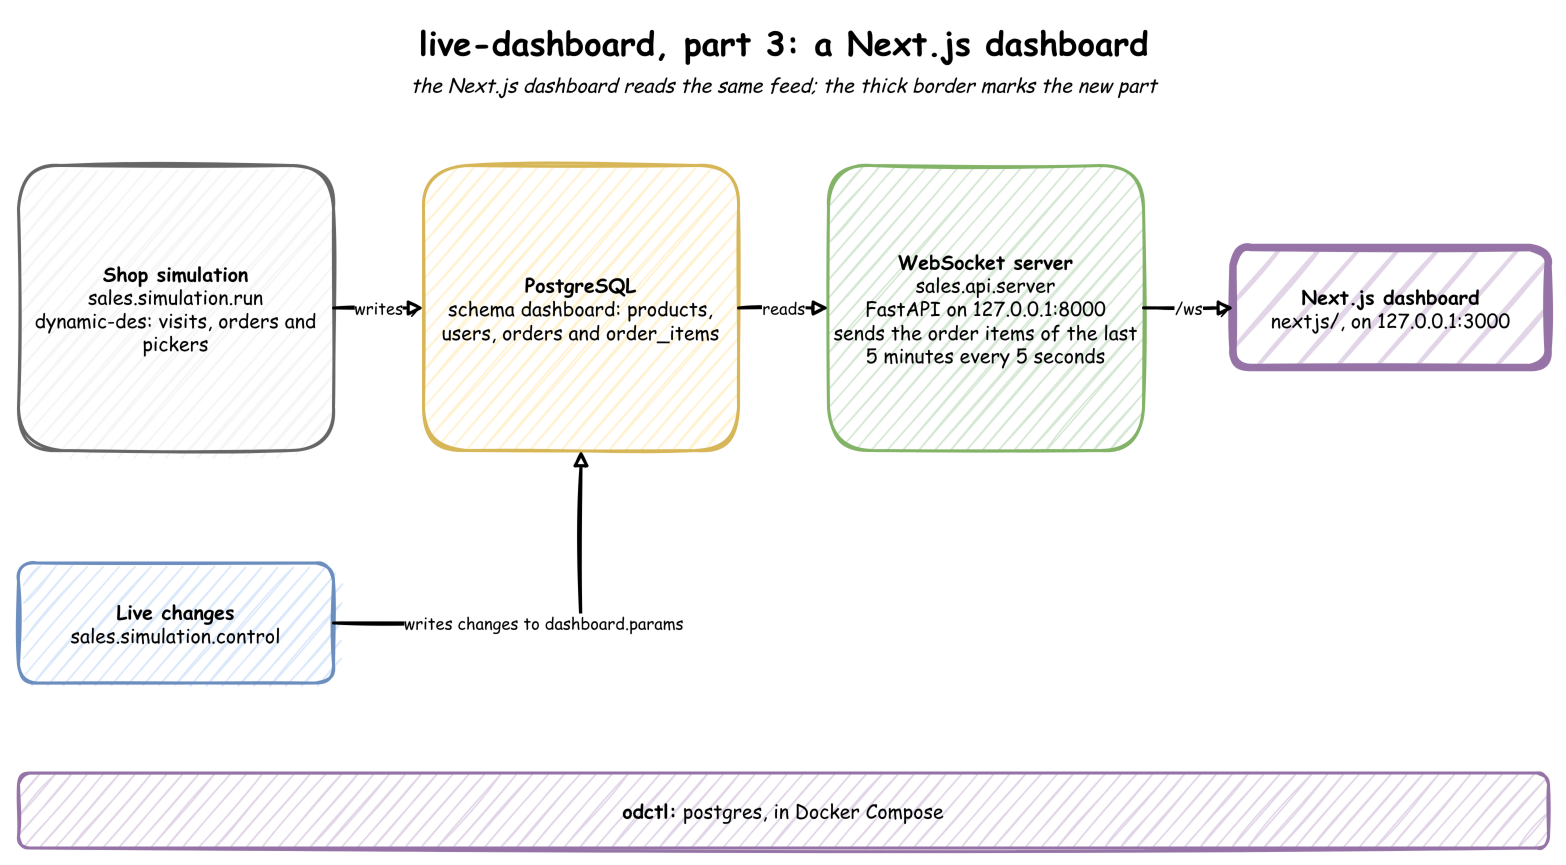
The Next.js dashboard processes and displays real-time theLook eCommerce data. It connects to the WebSocket server using the React useWebSocket package, while the UI is styled with HeroUI (formerly NextUI) and Tailwind CSS. Visualizations are powered by Apache ECharts. The source code for this post is available in the live-dashboard folder of the benchtop GitHub repository. It is one of the Benchtop projects, which run locally from a fresh clone.
Metric Component
We use a React component called Metric that displays a metric card with the following props:
label: The title or name of the metric.value: The value of the metric (could represent a number or currency).delta: The change in the metric value (used to indicate increase or decrease).is_currency: A boolean flag to indicate whether the value should be formatted as a currency.
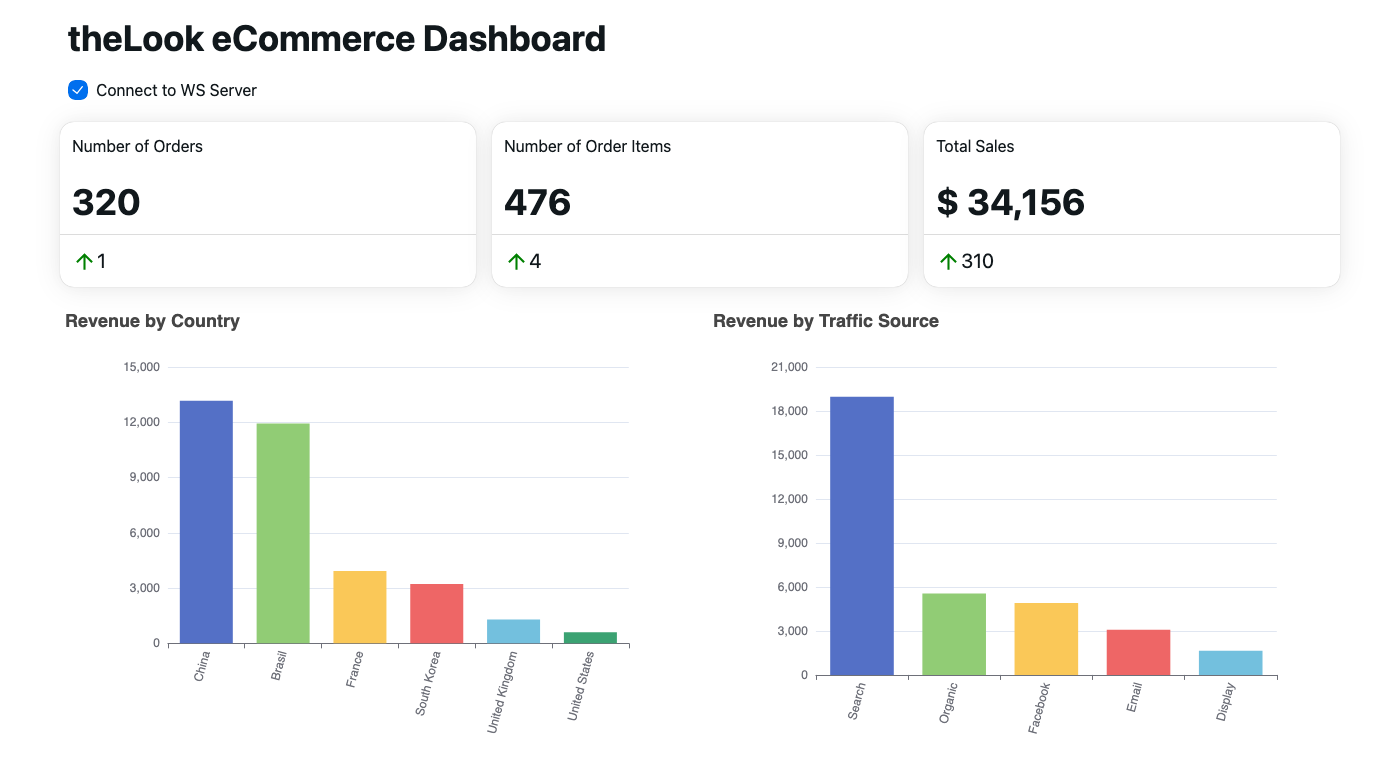
The card’s visual layout includes the label at the top, the formatted value in large text, and the delta change with an arrow beneath it.
 1// live-dashboard/nextjs/src/components/metric.tsx
 2"use client";
 3
 4import {
 5  Card,
 6  CardHeader,
 7  CardBody,
 8  Divider,
 9  CardFooter,
10} from "@nextui-org/react";
11
12export interface MetricProps {
13  label: string;
14  value: number;
15  delta: number;
16  is_currency: boolean;
17}
18
19export default function Metric({
20  label,
21  value,
22  delta,
23  is_currency,
24}: MetricProps) {
25  const formatted_value = is_currency
26    ? "$ ".concat(value.toLocaleString())
27    : value.toLocaleString();
28  const arrowColor = delta == 0 ? "black" : delta > 0 ? "green" : "red";
29  return (
30    <div className="col-span-12 md:col-span-4">
31      <Card>
32        <CardHeader>{label}</CardHeader>
33        <CardBody>
34          <h1 className="text-4xl font-bold">{formatted_value}</h1>
35        </CardBody>
36        <Divider />
37        <CardFooter>
38          <svg
39            height={25}
40            viewBox="0 0 24 24"
41            aria-hidden="true"
42            focusable="false"
43            fill={arrowColor}
44            xmlns="http://www.w3.org/2000/svg"
45            color="inherit"
46          >
47            <path fill="none" d="M0 0h24v24H0V0z"></path>
48            <path d="M4 12l1.41 1.41L11 7.83V20h2V7.83l5.58 5.59L20 12l-8-8-8 8z"></path>
49          </svg>
50          <h1 className="text-xl">{delta.toLocaleString()}</h1>
51        </CardFooter>
52      </Card>
53    </div>
54  );
55}
Data Processing Utility
Since I have yet to find an effective data manipulation library comparable to Python’s Pandas, data processing is handled using custom objects and functions. The code primarily operates on arrays of Records to compute sales metrics and generate visual representations. The getMetrics and createMetricItems functions are used to calculate current/delta metrics and construct an array of MetricProps that can be added to the Metric component. Also, the createOptionsItems function is responsible for generating data visualizations, specifically bar charts that show revenue by categories such as country and traffic source.
 1// live-dashboard/nextjs/src/lib/processing.ts
 2// Turns the WebSocket's records into metric cards and chart options, with no React.
 3// The Streamlit dashboard does the same in sales/dashboard/metrics.py.
 4import { EChartsOption } from "echarts-for-react";
 5
 6import { MetricProps } from "@/components/metric";
 7
 8export interface Record {
 9  user_id: string;
10  age: number;
11  gender: string;
12  country: string;
13  traffic_source: string;
14  order_id: string;
15  item_id: string;
16  category: string;
17  cost: number;
18  item_status: string;
19  sale_price: number;
20  created_at: string;
21}
22
23export interface Metrics {
24  num_orders: number;
25  num_order_items: number;
26  total_sales: number;
27}
28
29const LABELS: { [K in keyof Metrics]: string } = {
30  num_orders: "Number of Orders",
31  num_order_items: "Number of Order Items",
32  total_sales: "Total Sales",
33};
34const CHARTS = { country: "Country", traffic_source: "Traffic Source" }; // revenue grouped by
35
36export const defaultMetrics: Metrics = { num_orders: 0, num_order_items: 0, total_sales: 0 };
37
38export function getMetrics(records: Record[]): Metrics {
39  return {
40    num_orders: new Set(records.map((r) => r.order_id)).size,
41    num_order_items: new Set(records.map((r) => r.item_id)).size,
42    total_sales: Math.round(records.reduce((sum, r) => sum + r.sale_price, 0)),
43  };
44}
45
46export function createMetricItems(current: Metrics, previous: Metrics): MetricProps[] {
47  return (Object.keys(LABELS) as (keyof Metrics)[]).map((key) => ({
48    label: LABELS[key],
49    value: current[key],
50    delta: current[key] - previous[key],
51    is_currency: key === "total_sales",
52  }));
53}
54
55export function createOptionsItems(records: Record[]): EChartsOption[] {
56  return (Object.keys(CHARTS) as (keyof typeof CHARTS)[]).map((column) => {
57    const revenue = new Map<string, number>();
58    for (const r of records) revenue.set(r[column], (revenue.get(r[column]) ?? 0) + r.sale_price);
59    const bars = [...revenue].sort((a, b) => b[1] - a[1]);
60    return {
61      title: { text: `Revenue by ${CHARTS[column]}` },
62      grid: { containLabel: true }, // room for the rotated axis labels
63      xAxis: { type: "category", data: bars.map(([name]) => name), axisLabel: { rotate: 75 } },
64      yAxis: { type: "value" },
65      series: [{ type: "bar", colorBy: "data", data: bars.map(([, value]) => Math.round(value)) }],
66      tooltip: { trigger: "axis", axisPointer: { type: "shadow" } },
67    };
68  });
69}
Application
The main component builds a real-time eCommerce dashboard that connects to a WebSocket server at ws://127.0.0.1:8000/ws to fetch and display live data. A hook, useDashboard, uses the React useWebSocket package (react-use-websocket) to manage the WebSocket connection, and whenever new data is received, it updates the state with the latest metrics and chart options. The data processing is handled by helper functions (getMetrics, createMetricItems, and createOptionsItems), which compute summary metrics and prepare visualization data. The UI dynamically updates to display key business metrics using the Metric component and interactive bar charts powered by Apache ECharts (echarts-for-react). A checkbox allows users to toggle the WebSocket connection on or off, giving them control over real-time updates.
 1// live-dashboard/nextjs/src/lib/useDashboard.ts
 2import { useEffect, useRef, useState } from "react";
 3import { EChartsOption } from "echarts-for-react";
 4import useWebSocket from "react-use-websocket";
 5
 6import { MetricProps } from "@/components/metric";
 7import { createMetricItems, createOptionsItems, defaultMetrics, getMetrics, Record } from "@/lib/processing";
 8
 9// Follows the WebSocket while `connected`, and turns each message into cards and charts.
10export default function useDashboard(url: string, connected: boolean) {
11  const [metricItems, setMetricItems] = useState<MetricProps[]>(createMetricItems(defaultMetrics, defaultMetrics));
12  const [chartOptions, setChartOptions] = useState<EChartsOption[]>([]);
13  const previous = useRef(defaultMetrics);
14  const { lastJsonMessage } = useWebSocket<Record[]>(url, { share: false, shouldReconnect: () => true }, connected);
15
16  useEffect(() => {
17    if (!lastJsonMessage) return;
18    const metrics = getMetrics(lastJsonMessage);
19    setMetricItems(createMetricItems(metrics, previous.current));
20    setChartOptions(createOptionsItems(lastJsonMessage));
21    previous.current = metrics;
22  }, [lastJsonMessage]);
23
24  return { metricItems, chartOptions };
25}
 1// live-dashboard/nextjs/src/app/page.tsx
 2"use client";
 3
 4import { useState } from "react";
 5import { Checkbox } from "@nextui-org/react";
 6import ReactECharts from "echarts-for-react";
 7
 8import Metric from "@/components/metric";
 9import useDashboard from "@/lib/useDashboard";
10
11export default function Home() {
12  const [connected, setConnected] = useState(false);
13  const { metricItems, chartOptions } = useDashboard("ws://127.0.0.1:8000/ws", connected);
14
15  return (
16    <div>
17      <div className="mt-20">
18        <div className="flex m-2 justify-between items-center">
19          <h1 className="text-4xl font-bold">theLook eCommerce Dashboard</h1>
20        </div>
21        <div className="flex m-2 mt-5 justify-between items-center">
22          <Checkbox color="primary" onChange={() => setConnected(!connected)}>
23            Connect to WS Server
24          </Checkbox>
25        </div>
26      </div>
27      <div className="grid grid-cols-12 gap-4 mt-5">
28        {metricItems.map((item, i) => (
29          <Metric key={i} {...item} />
30        ))}
31      </div>
32      <div className="grid grid-cols-12 gap-4 mt-5">
33        {chartOptions.map((option, i) => (
34          <ReactECharts key={i} className="col-span-12 md:col-span-6" option={option} style={{ height: "500px" }} />
35        ))}
36      </div>
37    </div>
38  );
39}
Deployment
Data Producer and WebSocket Server
As discussed in Part 1, PostgreSQL is started with odctl up postgres, and the data generator and WebSocket server are started with python -m sales.simulation.run and uvicorn sales.api.server:app --host 127.0.0.1 --port 8000, each in its own terminal. Once started, the server can be checked with the WebSocket client of the websockets package by executing python -m websockets ws://127.0.0.1:8000/ws, and its logs are printed in its terminal.
The client prints each message the server sends: a list of the order items of the last five minutes, here 39 records in the first message.
1python -m websockets ws://127.0.0.1:8000/ws
1Connected to ws://127.0.0.1:8000/ws.
2< [{"user_id":"427f5544-f594-4127-826e-912dc0dd970e","age":40,"gender":"M","country":"China","traffic_source":"Search","order_id":"e8c140bd-087a-4dfe-ac01-29f40a36a27e","item_id":"40deff28-0310-49ed-b11b-fdf0a3dabb24","category":"Active","cost":24.7,"item_status":"Shipped","sale_price":55.04,"created_at":"2026-09-30T13:57:06.948553+00:00"}, ...]
The server logs how many records it sends every five seconds:
1INFO:     Started server process [...]
2INFO:     Waiting for application startup.
3INFO:     Application startup complete.
4INFO:     Uvicorn running on http://127.0.0.1:8000 (Press CTRL+C to quit)
5INFO:     127.0.0.1:54478 - "WebSocket /ws" [accepted]
6INFO:     connection open
7INFO:     Sending 39 records
8INFO:     Sending 54 records
9INFO:     Sending 67 records
Frontend Dashboard
The dashboard can be started in development mode as shown below. Once started, it can be accessed in a browser at http://127.0.0.1:3000.
1## install pnpm if not done
2# https://pnpm.io/installation
3
4## install dependent packages
5$ cd nextjs
6$ pnpm install
7
8## start the app
9$ pnpm dev


Comments