Command Line
The desflow command runs a model without a line of Python, and also checks it, compares designs, fits measured times and converts a distribution's parameters. This page uses each command in the order a study uses it, on one shop, and says what each output tells you.
What It Is
desflow is installed with the package: uv tool install desflow, or pip install desflow. Each task is a command of its own, such as desflow run or desflow explain. desflow on its own lists them by task, with examples. The --help of each command, such as desflow run --help, lists its options and ends with examples of that command. Each command below links to a page with its full help:
| Command | What it does |
|---|---|
desflow run |
Build the simulation in FILE and run it, or run replications of it. |
desflow check |
Check that each blueprint or builder file in FILE... builds, without running it. |
desflow test |
Run the tests of each file in FILE... and report the statistics that differ. |
desflow explain |
Show the model in SOURCE as a graph, with its utilisation, status, waits and tuning hints where the queueing formulas apply, and why where they do not. |
desflow experiment |
Run the experiment in FILE and write its artifacts and report. |
desflow report |
Build the report of an experiment again from the artifacts in FOLDER. |
desflow fit |
Fit a column of FILE to the distribution families, and exit 1 if none is usable. |
desflow dist |
List the distribution families, or convert parameters to a mean and std and back. |
desflow schema |
Print the blueprint JSON Schema. |
desflow examples |
List the examples, or download one at the version you have installed. |
desflow examples list |
List the examples, with what each shows and what it needs. |
desflow examples get |
Download an example into <dest>/<name>/<api>/, at the installed release. |
The help of desflow
The shop on this page is the model of the experiment example: two packers, an order every 2.5 seconds on average, and 4 seconds of packing on average. Every command runs in one folder and needs no Docker service. desflow fit needs the fit extra: uv tool install "desflow[fit]", or pip install "desflow[fit]".
How to Use It
Get an Example
desflow --version prints the release you installed. desflow examples list, or desflow examples alone, lists every example with the service it needs, such as (no service) or (odctl up kafka-lite):
desflow examples get downloads one example at the release you installed, into a folder named after it:
The model is experiment_shop.yaml, and experiment.yaml is the experiment that compares two designs of it. observed_waits.csv holds the mean wait measured in the real shop. The line before the last runs desflow explain on the model, and the last line is the command that runs the example from its own folder. --api builder or --api low-level downloads the same example in Python.
--dest downloads into another folder, and --ref downloads from another tag or branch, such as main for an example added after your release:
The builder version goes under shop/experiment/builder, and the last line runs it from there. A file that is already there stops the download before anything is written, and --force replaces it instead. This line downloads the YAML version again, over the files of the first download, and prints the same lines as the first download:
Check a File Before You Run It
desflow check builds each blueprint or builder file you give it, and does not run it. It reports what desflow run reports before the clock starts: YAML errors, unknown keys, missing names, unset variables, !python references that cannot be imported, and connectors whose extra is missing or whose settings are refused. It does not call run.before, contact a broker, a database or a catalog, or run a !python function. Importing a !python module runs its top-level code, as desflow run does. It prints ok FILE (sim_id ID) for each valid file and every error of an invalid one, and exits 1 if any file is invalid.
The commands below use a small shop in a file of its own. Its packers come from the variable PACKERS, 2 when it is not set, and it holds one test. Save it as shop.yaml:
A builder file has no ${PACKERS} variable and no test section: its values are Python. desflow check and desflow run take a builder file too, and Test a Model shows how to test one with pytest.
A low-level script is not a file the command reads. Run it with python, and test it with pytest as Test a Model shows.
desflow check takes more than one file, and --var NAME=VALUE fills ${NAME} in the files and in the files they include, before the environment does. Repeat --var for more variables:
It also warns about a run with no end: an arrival with a dist or a gap and no max_events, in a file with no run.until, run.stop or run.segments. The experiment's shop gives no until, because the experiment file gives it, so check warns about it and still prints ok. A tests entry with no seed, in a file with no seed of its own, is reported as desflow test reports it.
desflow ships no pre-commit hook. A repository that keeps its blueprints in a folder can add its own to .pre-commit-config.yaml. pre-commit passes the changed files as the arguments, which check takes:
| .pre-commit-config.yaml | |
|---|---|
desflow test runs the tests that a file holds under tests. A test names a seed, an end time and the statistics its run must give. It runs the model once, unpaced, with no ingress and no egress, so a test contacts no service. It prints ok for each passing test and each difference of a failing one, and exits 1 if any test fails. A file with no tests prints no tests. A builder file reads its tests from a tests.yaml in its folder. --fix writes the measured statistics into the values that differ, and into a test with none, in place of reporting the differences. A statistic the run published as NaN cannot be written, so --fix reports that test as failed. Read the changes before you keep them, because a test states its numbers at one seed of one desflow version. Test a Model writes tests step by step.
Check It Before a Long Run
desflow explain reads the model without running it. It draws the model as a graph and works out each resource's utilisation, the share of its units that the arrivals keep busy. SOURCE is a blueprint, a builder Python file with a module-level SimulationContext, or a URI such as s3://bucket/sims/shop.yaml. A URI that ends in a folder is refused with its name, such as Error: no file s3://bucket/models/.

The same output as text:
The packers are at utilisation 0.8: they are busy 80% of the time. An order arrives every 2.5 seconds on average (24 a minute, rate 0.4/s in the graph). Each order needs 4 seconds of a packer, and 2 packers share the work. The resources table names its columns with the usual queueing symbols:
- λ (lambda) is the arrival rate, 0.4 orders a second.
- μ (mu) is the rate one packer serves, 0.25 orders a second (4 seconds each).
- ρ (rho) is the utilisation.
- Wq is the mean wait in the queue, and L the mean number of orders in the shop. Both show
-when no formula applies.
The line Bottleneck: packers names the resource with the highest utilisation. Relieving it makes the next busiest resource the bottleneck. The status is OK below 0.85, CONGESTED from 0.85 and UNSTABLE from 1, where the queue grows for as long as the run lasts. The table by units shows that one packer would be UNSTABLE. The hints give the units and the arrival rate that reach the target of 0.85. A hint of more units than the resource's max_cap also says to raise max_cap, because a current_cap above max_cap is lowered to it.
To keep a resource stable, lower its utilisation or its variability: more units (a higher current_cap), a shorter service time, a lower arrival rate, or less variable gaps or service times. To test how a consumer of the records copes, do the opposite on purpose. From utilisation 0.85 a resource is congested, with long waits that come and go. Above 1 it is overloaded and its queue grows for as long as the overload lasts.
--target sets the utilisation the hints aim for, 0.85 by default. At 1 or above the hints are for deliberate overload. This command uses the shop of Queues and Capacity, saved as queues_and_capacity.yaml:
The end of the output is the hints:
With 2 packers the shop runs at utilisation 1.35, above the target of 1.2. With 1 packer, an arrival rate of 0.8 orders a second (an order every 1.25 seconds, 48 a minute) gives exactly 1.2.
The formulas give no wait for two packers with gamma packing times, so the line under Not estimated says to measure it. Queues and Capacity works the same numbers out by hand.
--verify measures it. It runs the model unpaced and compares each statistic with the analysis, as Check Against Theory shows. With --replications, it runs the model that many times from --seed, each to --until, and compares with each measure's 95% interval. --target sets the utilisation the hints aim for:
The measured utilisation of 0.8017 and throughput of 0.3992 agree with the analysis, so the model does what the formulas say. The wait has no formula here, so the runs only measure it: 4.354 seconds. With a target of 0.9, the hints say that two packers reach it at an order every 2.22 seconds. --json prints the same explanation as one JSON object, for a script to read. Its schema_version names the shape, which the Explanation class describes:
Run It
desflow run --sample prints the first events as JSON lines. It runs the model unpaced, with no ingress, and with no sinks of the file's own, so a model that writes to Kafka or a database needs no service:
Each order publishes queued when it joins the packers' queue and started when a packer takes it. The first two orders find a packer free, so each starts at the moment it queues. Without --sample, desflow run runs the model with its own settings and sinks. A model that runs out of events before the sample is full ends with exit 0 and the records it made.
--var NAME=VALUE fills ${NAME} in the file and in the files it includes, before the environment does, and check and test take it too. explain and experiment do not take --var. --watch runs the file in a child process and runs it again whenever the file, or a .py file beside it, changes, so a change to a blueprint shows its first events at once. It needs the watch extra: pip install "desflow[watch]". Press Ctrl+C to stop it:
One run is one sample, so measure the wait with replications: the same model with ten seeds, each run for one hour:
The mean wait is 4.354 seconds, and its half-width of 0.5143 says that the true mean lies within about 0.51 seconds of it, with 95% confidence. The packers are busy 80.17% of the time, close to the 0.8 that explain worked out. The last line repeats any one replication, with its events. This shop has no sinks. A model with a sink, such as type: Console, also sends the result to it as telemetry: one reading for each replication and measure. A Console sink therefore prints those lines before the table, as What the Sinks Receive explains.
--measure names a statistic to summarise, and repeats for more. --level sets the confidence level of the intervals. --workers runs that many replications at once, each in its own process, and gives the same results, because each replication keeps its seed. The three apply to --replications, and desflow run refuses them without it:
The means are the same as before. At 99%, the half-width of the mean wait grows from 0.5143 to 0.7389 seconds, because more confidence needs a wider interval.
--stdout prints the run's records as JSON lines, instead of writing to the file's sinks. The run keeps its ingress connectors, so a KafkaIngress still applies its topic_policy: it creates the control topic, and with drop_and_create it deletes it and creates it again. --drain stops the arrivals at the end time and runs on until every order has left. This run stops the arrivals at 20 seconds, and its last record is the seventh order packed, at 20.502310430365075 seconds. A record keeps its time unrounded:
Compare Designs
desflow experiment runs an experiment: here two packers against three, 20 replications of each with the same seeds, with a check that three packers keep the mean wait under 2 seconds. --output names the folder for its files, here results/packers in the current folder. Without it, they go to the folder the file's output names, beside the file:
The check passed: the upper end of the interval of the mean wait with three packers is 0.5816 seconds, under the bound of 2. The command exits with status 1 when a check fails, so a CI job that runs it fails too. The six files in results/packers hold every value, and report.md compares the designs, as Experiment Results describes. After editing experiment.json by hand, desflow report builds the report again from the files, without running anything:
Fit Measured Times
A packing time in a model comes from measured times. The fitting example holds 40 packing times measured at a bench, for a shop of its own, and desflow fit fits every family of times to them:
The first line counts the values. Each row is one family: fitted with its AIC, where lower is better, or the reason it was not fitted. The triangular has the lowest AIC, 56.68, and the gamma is within 0.11 of it, so the data cannot tell the two apart. Fitting the Inputs checks what the choice changes.
The other options shape the fit, as Input Fitting describes:
--unitnames the data's unit,ms,s,minorh, and the settings are written in seconds.--upperis the highest plausible value, and a family that can draw above it is marked.--candidatesnames the families to try. The default is every family that fits times, ten of them.poissonandgeometriccount whole numbers, so a fit does not try them, and named in--candidatesthey are skipped with the reason that they count whole numbers.--binsoffers the empirical distribution as a histogram with that many bins.--min-countis the fewest values a family is fitted to.--toleranceis how far a fitted mean and standard deviation may be from the data's, as a share of the data's. A tolerance that is negative or NaN, and a bound that is NaN, are refused, and so is a name in--candidatesthat is not a family, which the refusal quotes.--drop-invalidleaves out values that are not numbers or lie outside the bounds, instead of stopping.--outwrites the best fit as YAML that a blueprint includes, and--plotdraws the data against it as a PNG.
The empirical row is now a histogram of 8 bins, and the gamma row is marked because a gamma can draw above 10 seconds. fitting/yaml/packing_fit.yaml is the file the fitting example's blueprint includes, so fitting/yaml/fitting.yaml now draws its packing times from this triangular.
Convert Parameters
A gamma takes a shape and a scale, not a mean and a standard deviation. desflow dist converts the measured times' mean of 1.5 seconds and standard deviation of 0.4832 seconds into them:
The shape and scale are close to the gamma that desflow fit found from the 40 values. The last two lines are the service in a blueprint and in the builder.
Given a family's own parameters, desflow dist converts the other way. Each of these lines prints the family's mean and standard deviation, as in the output above, for each kind of parameter: a rate, a constant's value, a low and a high, and a shape and a scale:
The shop's arrivals, rate: 0.4, are 2.5 seconds apart on average. A triangular also takes a mode, its most likely value. The one desflow fit found has a mean of 1.53 seconds, close to the measured 1.5:
poisson takes --mean, and geometric takes --p, the chance of success on each try. Both give whole numbers:
desflow dist alone prints a table of every family with its parameters and a one-line summary, and Choosing Inputs explains the variability line:
Set Up an Editor
desflow schema prints the JSON Schema of a blueprint, for the release you installed. An editor that reads it offers the keys as you type and marks a misspelt one:
Set Up Your Editor names the file in the editor's settings.
How It Works
Each command reads its file and calls the library function a Python script would call. desflow run loads the model with load_context and runs it once, or calls replicate when --replications is given. desflow experiment calls run_experiment, desflow report calls write_report, and desflow fit reads the column and calls fit_column. desflow dist, desflow schema and desflow examples read the distribution table, the blueprint schema and the list of examples. A command therefore gives the same result as the Python call with the same arguments.
desflow explain takes the most steps. Look at them in order:
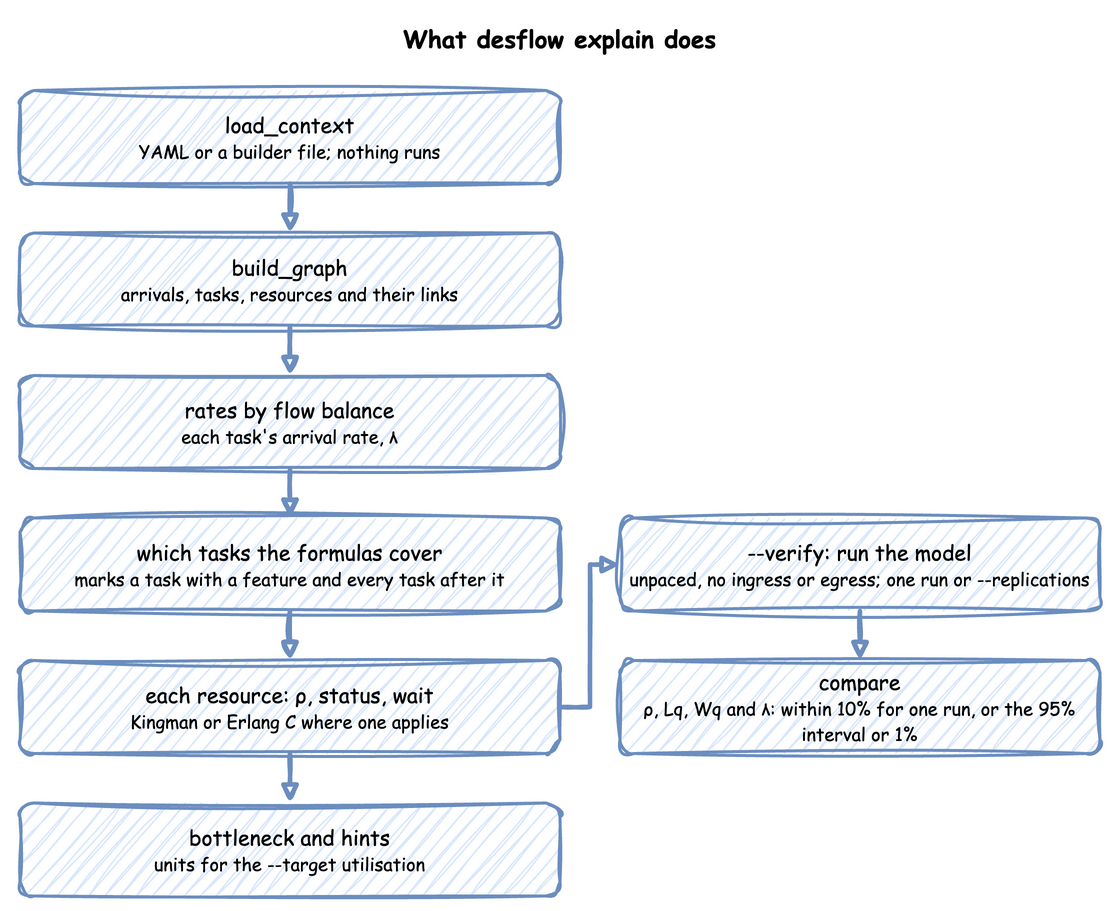
Graph. explain builds the graph from what the model declares: its arrivals, tasks, resources, stores, containers and next shares. It builds and runs nothing. Code the model does not declare, such as a hand-written arrival loop or an add_process function, becomes an opaque node. The graph also has an edge with no share from a task to each task it starts by an on: or listen spawn, a task branch of wait, open or subscribe, a spawn in the on: of a signal it fires, and on_interrupt_next and on_interrupt_run. next weights, fixed or computed, end no flow.
Rates. Each task's arrival rate comes from flow balance: the rate from its arrivals plus the share of each task that sends work to it. A next function or a hand-written arrival loop makes the rates unknown, because the graph cannot see where the work goes. A task reached by an edge with no share has no rate either, with the reason "how often
Coverage. The formulas hold for a plain network of queues:
- Each task holds at most one resource.
- Each queue serves in arrival order,
fifoorlifo, which give the same mean wait. - Nothing blocks, removes, delays or reorders work by priority.
Anything else marks tasks, and the rate of a marked task is unknown. These mark tasks:
- A task feature, such as
put,patience,fail, aservice_time(computed service time) or aninterruptthat names the task (interruptions (an interrupt names it)), marks that task and every task after it. - An arrival feature gives the arrival no rate, so the tasks it starts have none: a
gap(computed gaps), acount,keys, akeythat can repeat ormax_events(limited or repeated arrivals), agroupother than 1, andactive: false. A spawncountother than 1 is a feature too. - A resource feature, such as
queue_limit, breakdowns, a capacity that anon:entry sets, a resource family, or a resource picked bykeyorlowest, marks the tasks that use it and every task after them. - A router with a weight that is an expression ends no flow and has no shares.
- A priority queue whose tasks have different priorities marks every task after its tasks. The resource keeps its utilisation but has no wait.
- An unstable resource marks every task after its tasks. The resource keeps its status.
- A scenario step, an
on:entry that sets an arrival or a service, live ingress or anadd_processfunction marks every arrival and every task.
A resource used by a marked task has no supported utilisation, status or wait, and the output names the reason under Not estimated.
Waits. The utilisation ρ is λ ÷ (c × μ): the arrival rate divided by the units times the rate one unit serves. The status follows from it. The wait depends on the units and the input:
- With no unit limit, the wait is 0.
- At one unit, the wait comes from Kingman's formula. It is exact when the input is Poisson, and an approximation when one arrival with other gaps feeds the resource's only task.
- At more than one unit, the wait comes from Erlang C, which needs Poisson arrivals and one exponential service time shared by every task that uses the resource.
- With any other input or times there is no wait, and the output says to run
--verify.
Little's law then gives the queue length and the number in the system. The bottleneck is the resource with the highest supported utilisation. The hints solve the utilisation alone for the units and the arrival rate that reach --target.
Verify. --verify runs the model as one replication does: unpaced, with no ingress or egress, and with the typical statistics. It measures from the end of the warm-up to --until, or to the blueprint's run.until when --until is not given. It compares four measures with the analysis: each resource's utilisation and queue length, the wait of each task that holds one resource, and each arrival's throughput. A measure agrees with the analysis:
- For one run, when it is within 10% of the analysis, or measures 0 where the analysis gives 0.
- For replications, when it is within the 95% interval's half-width or 1%, whichever is larger.
A measure is not compared in these cases:
- The analysis has no value for it.
- Its resource is unstable.
- Its wait comes from Kingman's formula as an approximation.
- For a throughput, the arrival starts no task the graph shows, its flow passes a marked task or an unstable resource, or the blueprint has a
run.stopthat can end a run beforeuntil.
Stability and Limits
- Inputs are files.
runreads a blueprint, or a builder file with--sample(not with--stdout,--varor--watch),checka blueprint or a builder file,testa blueprint or a builder file with atests.yaml,explaina blueprint or a builder file with a module-levelSimulationContext,experimentan experiment file, andfita CSV file. For a Python model, usereplicateandrun_experiment, as Replications shows. - Examples need the network.
examples getdownloads from GitHub at the installed release's tag.--refpicks another tag or branch. explain --jsonis experimental. Its shape can change in 1.x, andschema_versionchanges with it.- Exit statuses: 0 on success, 1 on a failure, 2 on a usage error.
- 1:
run,check,testorexplaincannot load the file, atestdiffers from the measured statistics, anexperimentcheck fails (its files are still written),fitfinds no usable family, ordisthas no formula from a mean and a standard deviation for the family. - 2: a missing file, an option value that is not valid such as
--until abc, a value that is not a number in afitcolumn, or an experiment file that is not valid.
- 1: