Choosing Inputs compared four candidates for the packing time by hand and chose the 40 times measured at the bench. desflow can fit every distribution family to those times and say which fits best. This page asks: which supported distribution fits the 40 packing times, and does the choice change the busy hour's answer?
Decision: which fitted distribution the busy hour uses for packing.
Measures: how well each distribution fits the times, and the busy hour's mean wait with the two best fits and with the 40 times.
Runs: 40 replications of the busy hour with 3 packers for each distribution, with seeds spawned from 42, each after a 2-minute warm-up.
Assumptions: orders arrive at random at 1.8 a second, and the 40 times stand for every packer.
What You Will Learn
This page shows how to:
fit every distribution family to measured times with desflow fit;
read the AIC and the KS test of each fit, and look at the fit in a plot;
check whether the choice of fit changes the answer.
What You Add
This page runs desflow fit, or fit_column in Python, on the 40 packing times. It then uses the fitted settings in the busy hour of Choosing Inputs, in place of the times themselves. Fitting needs the fit extra, which adds scipy and matplotlib:
# The desflow command, with uvuvtoolinstall"desflow[fit]"# A Python file, with uv outside a projectuvrun--with"desflow[fit]"pythonfit_the_inputs.py
# In a uv projectuvadd"desflow[fit]"# With pippipinstall"desflow[fit]"
Fit the Packing Times
Save the files from Full Files in one folder, with packing.yaml and packing_gamma.yaml in a fitted folder inside it, and run the commands there. The two fit commands on this page write those two files again. Fit the times, which are in seconds and cannot be below 0:
# Fit the packing times, write the best fit and plot every candidatedesflowfitpacking_times.csv--columnpacking_seconds--lower0--outfitted/packing.yaml--plotfit.png
packing_times.csv, in Full Files, has a column packing_seconds with the 40 times. --out writes the best candidate's settings, and --plot draws the data against it.
# The 40 packing times, in seconds; none can be below 0result=fit_column(MEASURED,unit="s",lower=0)print(result.text())# every candidate, its status and diagnostics
# The 40 packing times, in seconds; none can be below 0result=fit_column(MEASURED,unit="s",lower=0)print(result.text())# every candidate, its status and diagnostics
desflow fits each family by maximum likelihood: it chooses the parameters under which the measured values are most probable. It then checks each fit and prints one row per family:
40 rows: 40 used, 0 missing, 0 invalid
family            status              AIC  KS stat KS p (approx.)  parameters or reason
exponential       rejected                                         its std is 1.5, the data's is 0.4832: more than 25% apart
normal            fitted            59.33    0.157         0.2504  mean=1.5, std=0.483218 (can draw below the lower bound 0)
lognormal         fitted            57.33  0.09406         0.8385  mean=1.50251, std=0.511854
truncated_normal  fitted            59.25   0.1558         0.2579  mean=1.49836, std=0.48579, low=0
constant          skipped                                          the values are not all equal
uniform           fitted            59.45    0.225        0.02923  low=0.7, high=2.7
triangular *      fitted            56.68   0.1258          0.511  low=0.546332, mode=1.2, high=2.83766
gamma             fitted            56.79   0.1157         0.6165  shape=9.55777, scale=0.15694
weibull           fitted            58.99   0.1502         0.2972  shape=3.33522, scale=1.67203
empirical         fitted                                           values: 40 numbers
* best: triangular
Lower AIC is better, and a small KS p-value is a reason to reject a family. A Simulation Study explains both scores. The KS stat column is the KS statistic, and the next column is its p-value. desflow reports the p-value but does not reject a family on it. Each family's outcome is:
triangular has the lowest AIC, 56.68, and is marked best. gamma is 0.11 behind it.
uniform stays fitted with a p-value of 0.029. That is below 0.05, which is a reason not to use it.
normal fitted, but it can draw values below 0. desflow does not choose it while another family that stays within the bounds fits.
exponential was rejected: its standard deviation equals its mean, 1.5 seconds, more than three times the data's 0.4832.
constant was skipped, because the times are not all equal.
empirical, the 40 times themselves, is always offered.
Look at the Fit
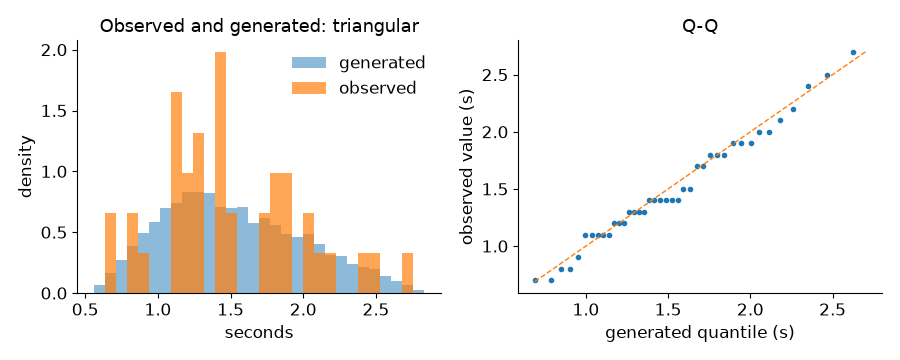
--plot, or result.plot("fit.png"), draws the data against 10,000 values drawn from the best fit through desflow's Sampler, as a run draws them:
On the left, the data and the generated values cover the same range. On the right, each sorted packing time is plotted against the generated value at the same quantile. Points on the diagonal mean the two agree. Forty values cannot show much more than that.
services:# The best fit of the 40 packing times, as desflow fit wrote it, or the fit# file the PACKING_FIT variable namespacking:!include${PACKING_FIT:-fitted/packing.yaml}
!include reads a mapping from another file, relative to the blueprint. The file desflow fit wrote:
# Fitted by desflow fit from packing_times.csv, column packing_seconds: triangular, from 40 values in s, written in seconds.dist:triangularlow:0.546332mode:1.2high:2.83766
params=SimParameter(sim_id="Shop",arrival={"orders":DistributionConfig(dist="exponential",rate=1.8)},# The best fit's settings: dist="triangular", low, mode and highservice={"packing":DistributionConfig(**packing)},resources={"packers":CapacityConfig(current_cap=3,max_cap=10)},)
result.settings() returns the best candidate's settings, and result.settings("gamma") returns the gamma's. Both keep six significant digits, as the file does, so a script and a blueprint that use the same fit draw the same values.
Does the Choice Matter?
Run the busy hour 40 times with each distribution, each time with a different seed. These runs are replications. The mean wait differs from one replication to the next. The 95% half-width below says how far the mean of the 40 replications can be from the true mean wait. Each replication also leaves out its first 2 minutes, a warm-up, because the shop starts empty and its first orders wait less than later ones. Trusting Results shows how to choose both numbers.
In YAML, desflow run fit_the_inputs.yaml --replications 40 --measure tasks.pack_order.wait_mean runs the best fit, and What You Get and Why shows the gamma's commands. The table gives each distribution's mean packing time, and the mean wait over the 40 replications with its half-width:
Packing time
Mean packing time (s)
Mean wait over 40 replications (s)
triangular, the lowest AIC
1.53
2.93 ± 0.25
gamma
1.50
2.33 ± 0.19
the 40 times
1.50
2.32 ± 0.20
What You Get and Why
Which supported distribution fits the 40 packing times? The triangular has the lowest AIC, but the gamma fits almost as well, 0.11 behind. By the guideline in AIC and the KS Test, a difference this small does not tell two fits apart. The choice does change the answer. Over 40 replications after a 2-minute warm-up, with seeds spawned from 42, the triangular gives a mean wait of 2.93 ± 0.25 seconds, and the gamma 2.33 ± 0.19, which agrees with the 2.32 ± 0.20 of the 40 times. The gamma fits almost as well and gives the same answer as the measured times, so it is the better choice for this question.
The first file the page loads holds the triangular only because desflow fit writes the candidate with the lowest AIC. An AIC difference this small does not make it the better fit. --candidates gamma fits only the gamma, and PACKING_FIT makes the blueprint include its file:
# Fit only the gammadesflowfitpacking_times.csv--columnpacking_seconds--lower0--candidatesgamma--outfitted/packing_gamma.yaml
# 40 runs with the gamma packing timesPACKING_FIT=fitted/packing_gamma.yamldesflowrunfit_the_inputs.yaml--replications40--measuretasks.pack_order.wait_mean
# Fitted by desflow fit from packing_times.csv, column packing_seconds: gamma, from 40 values in s, written in seconds.dist:gammashape:9.55777scale:0.15694
In Python, result.settings("gamma") gives the same settings, as the Builder and Low-level scripts in Full Files show.
The triangular's mean is (0.546 + 1.2 + 2.838) ÷ 3 = 1.53 seconds, 2% above the data's 1.50. The gamma keeps the data's mean exactly: shape × scale = 9.558 × 0.157 = 1.50. With the packers busy 90% of the time, 2% more packing raises utilisation to about 0.92, and the packers' spare time falls from 10% to about 8%, a fifth less. The wait depends on the spare time, as Waits Near Full Use shows, so it grows far more than 2%: 2.93 seconds against 2.33. Common Mistakes lists the choice of a family by habit, and Input Fitting describes every option and outcome.
Key Takeaways
The family with the lowest AIC is not always the best choice: a small difference in AIC does not tell two fits apart.
A fit that changes the mean, even by 2%, can change the waits much more when the resource is busy.
Run the question with each close fit, and choose the one whose answer agrees with the data.
# The Fitting the Inputs tutorial: the busy hour, with a packing time fitted to the data.# Fit, then run it:# desflow fit packing_times.csv --column packing_seconds --lower 0 --out fitted/packing.yaml# desflow run fit_the_inputs.yaml# 40 replications: desflow run fit_the_inputs.yaml --replications 40 --measure tasks.pack_order.wait_mean# The gamma fit instead: write fitted/packing_gamma.yaml with --candidates gamma, then# PACKING_FIT=fitted/packing_gamma.yaml desflow run fit_the_inputs.yamlsimulation:sim_id:Shopfactor:0random_seed:42warmup:2 minresources:packers:{current_cap:3, max_cap:10}arrivals:orders:{dist:exponential, rate:1.8, spawn:pack_order}services:# The best fit of the 40 packing times, as desflow fit wrote it, or the fit# file the PACKING_FIT variable namespacking:!include${PACKING_FIT:-fitted/packing.yaml}tasks:pack_order:service:packingresource:packerspayload:{event_type:order_packed}stats:typicalrun:until:1 h
# Fitted by desflow fit from packing_times.csv, column packing_seconds: triangular, from 40 values in s, written in seconds.dist:triangularlow:0.546332mode:1.2high:2.83766
# Fitted by desflow fit from packing_times.csv, column packing_seconds: gamma, from 40 values in s, written in seconds.dist:gammashape:9.55777scale:0.15694
"""The Fitting the Inputs tutorial: which distribution fits the 40 packing times? builder.Fits every family to the 40 packing times measured at the bench and prints the tableof candidates. Then it runs the busy hour 40 times with each of three packingdistributions: the best fit, the gamma fit and the 40 times themselves. Each runleaves out a 2-minute warm-up. The script prints the mean wait for each distribution."""importloggingfromdesflowimportSimulationContext,fit_column,replicatefrommeasuring_a_runimportMEASURED# The imported model logs at INFO; replications log only their warningslogging.getLogger("desflow").setLevel(logging.WARNING)deffitted():"""Every family fitted to the measured times."""# The 40 packing times, in seconds; none can be below 0result=fit_column(MEASURED,unit="s",lower=0)print(result.text())# every candidate, its status and diagnosticsreturnresultdefshop(packing=None)->SimulationContext:"""The busy hour; `packing` is a fit's settings, or None for the 40 times."""ifpackingisNone:packing={"dist":"empirical","values":MEASURED}app=(SimulationContext(sim_id="Shop",factor=0,random_seed=42,warmup="2 min").add_resource("packers",current_cap=3,max_cap=10).add_arrival("orders",dist="exponential",rate=1.8)# The best fit's settings: dist="triangular", low, mode and high.add_service("packing",**packing).with_stats("typical"))@app.task(service_id="packing",resource_id="packers")defpack_order(task_id:int):return{"event_type":"order_packed"}@app.arrival_loop("orders")deforder_generator(context:SimulationContext):task_id=0whileTrue:order=yieldcontext.wait_for_arrival("orders")context.spawn(pack_order(task_id,entity=order))task_id+=1returnappdefmean_waits(result)->dict:"""The mean wait over 40 replications, with each packing distribution."""choices={"triangular":result.settings(),"gamma":result.settings("gamma"),"empirical":None,}return{name:replicate(lambda:shop(packing),40,seed=42,until="1 h",measures=["tasks.pack_order.wait_mean"],).summary[0]forname,packinginchoices.items()}if__name__=="__main__":forname,rowinmean_waits(fitted()).items():print(f"{name}: mean wait {row['mean']:.2f} ± {row['half_width']:.2f} s")
"""The Measuring a Run tutorial: the busy hour, with built-in statistics, builder.Three packers, orders at 1.8 a second and the measured packing times. Every record,the statistics included, is printed to the terminal, and the script prints the finalstatistics again at the end."""importloggingfromdesflowimportConsoleEgress,SimulationContextlogging.basicConfig(level=logging.INFO,format="%(levelname)s [%(asctime)s] %(message)s")# The 40 packing times measured at the bench, in secondsMEASURED=[1.5,2.5,2.4,1.2,1.3,1.2,1.8,1.4,2.0,0.7,2.7,1.4,1.9,1.4,1.3,1.8,2.0,1.4,1.4,1.9,1.1,0.8,1.7,1.1,0.7,1.1,1.2,0.9,0.8,1.5,2.1,1.3,1.1,1.7,1.9,1.3,1.8,2.2,1.4,1.1,]# fmt: skipapp=(SimulationContext(sim_id="Shop",factor=0,random_seed=42).add_resource("packers",current_cap=3,max_cap=10).add_arrival("orders",dist="exponential",rate=1.8).add_service("packing",dist="empirical",values=MEASURED)# Counts, time averages, and the mean and maximum wait and service, every 10 s.with_stats("typical").add_egress(ConsoleEgress()))@app.task(service_id="packing",resource_id="packers")defpack_order(task_id:int):return{"event_type":"order_packed"}@app.arrival_loop("orders")deforder_generator(context:SimulationContext):task_id=0whileTrue:order=yieldcontext.wait_for_arrival("orders")context.spawn(pack_order(task_id,entity=order))task_id+=1if__name__=="__main__":app.run(until="1 h")# The statistics are telemetry, so the console printed them; read them here tooforname,valueinapp.env.stats.readings().items():print(f"{name} = {value}")
"""The Fitting the Inputs tutorial: which distribution fits the 40 packing times? low-level.Fits every family to the 40 packing times measured at the bench and prints the tableof candidates. Then it runs the busy hour 40 times with each of three packingdistributions: the best fit, the gamma fit and the 40 times themselves. Each runleaves out a 2-minute warm-up. The script prints the mean wait for each distribution."""importloggingfromdesflowimport(CapacityConfig,DistributionConfig,DynamicResource,LowLevelModel,SimParameter,fit_column,replicate,)frommeasuring_a_run_low_levelimportMEASURED,order_generator# The imported model logs at INFO; replications log only their warningslogging.getLogger("desflow").setLevel(logging.WARNING)# Records and statistics start after the first 2 minutes of each runWARMUP=120.0# secondsdeffitted():"""Every family fitted to the measured times."""# The 40 packing times, in seconds; none can be below 0result=fit_column(MEASURED,unit="s",lower=0)print(result.text())# every candidate, its status and diagnosticsreturnresultdefbusy_hour(packing):"""The busy hour's model, with a packing distribution's settings."""params=SimParameter(sim_id="Shop",arrival={"orders":DistributionConfig(dist="exponential",rate=1.8)},# The best fit's settings: dist="triangular", low, mode and highservice={"packing":DistributionConfig(**packing)},resources={"packers":CapacityConfig(current_cap=3,max_cap=10)},)defmodel(env,sampler):env.registry.register_sim_parameter(params)packers=DynamicResource(env,"Shop","packers")env.process(order_generator(env,sampler,packers))returnLowLevelModel(model,sim_id="Shop")defmean_waits(result)->dict:"""The mean wait over 40 replications, with each packing distribution."""choices={"triangular":result.settings(),"gamma":result.settings("gamma"),"empirical":{"dist":"empirical","values":MEASURED},}return{name:replicate(busy_hour(packing),40,seed=42,until=3600,warmup=WARMUP,measures=["tasks.pack_order.wait_mean"],).summary[0]forname,packinginchoices.items()}if__name__=="__main__":forname,rowinmean_waits(fitted()).items():print(f"{name}: mean wait {row['mean']:.2f} ± {row['half_width']:.2f} s")
"""The Measuring a Run tutorial: the busy hour, with built-in statistics, low-level.Three packers, orders at 1.8 a second and the measured packing times. The orderprocess reports each step to the environment's statistics, which publish them astelemetry; the script prints the final statistics again at the end."""importloggingfromdesflowimport(CapacityConfig,ConsoleEgress,DistributionConfig,DynamicRealtimeEnvironment,DynamicResource,Sampler,SimParameter,)logging.basicConfig(level=logging.INFO,format="%(levelname)s [%(asctime)s] %(message)s")# The 40 packing times measured at the bench, in secondsMEASURED=[1.5,2.5,2.4,1.2,1.3,1.2,1.8,1.4,2.0,0.7,2.7,1.4,1.9,1.4,1.3,1.8,2.0,1.4,1.4,1.9,1.1,0.8,1.7,1.1,0.7,1.1,1.2,0.9,0.8,1.5,2.1,1.3,1.1,1.7,1.9,1.3,1.8,2.2,1.4,1.1,]# fmt: skipPARAMS=SimParameter(sim_id="Shop",arrival={"orders":DistributionConfig(dist="exponential",rate=1.8)},service={"packing":DistributionConfig(dist="empirical",values=MEASURED)},resources={"packers":CapacityConfig(current_cap=3,max_cap=10)},)defpack_order(env,sampler,packers,key,task_id):"""One order, which reports each step to the statistics."""path_id="Shop.service.packing"defpublish(value):env.publish_event(key,value,task="pack_order",instance=task_id)publish({"path_id":path_id,"status":"queued"})env.stats.task_queued("pack_order",task_id)withpackers.request()asrequest:yieldrequestpublish({"path_id":path_id,"status":"started"})env.stats.task_started("pack_order",task_id)yieldenv.timeout(sampler.sample(env.registry.get_config(path_id)))publish({"event_type":"order_packed"})env.stats.task_finished("pack_order",task_id)env.stats.flow_finished("orders")# the order leaves the shopdeforder_generator(env,sampler,packers):arrival=env.registry.get_config("Shop.arrival.orders")task_id=0whileTrue:yieldenv.timeout(sampler.sample(arrival))env.stats.flow_started("orders")# the order enters the shopenv.process(pack_order(env,sampler,packers,f"orders-{task_id+1}",task_id))task_id+=1defrun(until=3600,factor=0.0):env=DynamicRealtimeEnvironment(factor=factor)env.registry.register_sim_parameter(PARAMS)env.setup_egress([ConsoleEgress()])# Counts, time averages, and the mean and maximum wait and service, every 10 senv.setup_stats("Shop","typical",interval=10)packers=DynamicResource(env,"Shop","packers")env.process(order_generator(env,Sampler(seed=42),packers))try:env.run(until=until)finally:env.teardown()returnenvif__name__=="__main__":env=run()# The statistics are telemetry, so the console printed them; read them here tooforname,valueinenv.stats.readings().items():print(f"{name} = {value}")