Most of the pages so far read one number, the mean wait. A run knows much more. This page asks: what does a run tell me?
Decision: which numbers to read from a run before acting on it.
Measures: five of the numbers the run publishes: the packers' utilisation, the mean queue, the mean and longest wait, and the orders packed.
Runs: one run of the busy hour, with the seed 42, starting with an empty shop.
Assumptions: orders arrive at random at 1.8 a second, and the times measured at the bench stand for every packer.
What You Will Learn
This page shows how to:
switch on the built-in statistics at a level;
read utilisation, queue length, waits and counts at the end of a run;
check the statistics against each other with Little's Law.
What You Add
This page adds stats: typical, the built-in statistics at the level that includes waits. The model simulates the busy hour with 3 packers from Queues and Capacity, and draws each packing time from 40 times measured at the bench, each equally likely. The model calls this an empirical distribution. Real packing times vary, so these times describe the shop better than the constant 1.5 seconds of the earlier pages; Choosing Inputs explains the distribution and compares it with others.
Switch On Statistics
desflow keeps statistics about a run as it goes. It publishes them as telemetry every 10 simulation seconds and once more at the end, so the last value of each statistic is the state at the end of the run. Statistics are off by default, because most runs only generate data. A level switches them on: none (the default), minimal, basic, typical or all, each publishing what the one before it does and more. typical adds each task's mean and maximum wait and service time. Statistics lists what each level adds. Switch on typical:
# Counts, time averages, and the mean and maximum wait and service, every 10 senv.setup_stats("Shop","typical",interval=10)
The environment keeps the statistics in env.stats. Resources report their own changes. A low-level process has no task for desflow to watch, so the process reports each step itself. It calls env.stats.task_queued, task_started and task_finished with the task's name and instance id, and flow_started and flow_finished when the order enters and leaves the shop. The full file below shows them.
The statistics are telemetry, so they reach every sink, and they can also be read in Python at the end of the run:
if__name__=="__main__":app.run(until="1 h")# The statistics are telemetry, so the console printed them; read them here tooforname,valueinapp.env.stats.readings().items():print(f"{name} = {value}")
if__name__=="__main__":env=run()# The statistics are telemetry, so the console printed them; read them here tooforname,valueinenv.stats.readings().items():print(f"{name} = {value}")
Every name has the same form, <sim_id>.stats.<kind>.<name>.<statistic>, such as Shop.stats.tasks.pack_order.wait_mean. Save the files from Full Files in one folder and run the commands there: desflow run measuring_a_run.yaml, python measuring_a_run.py or python measuring_a_run_low_level.py. These are the statistics published at the end of the hour:
utilization_avg 86.56: the packers were busy 86.56% of the time. The utilisation statistics are percentages, while desflow explain and --verify give utilisation as a fraction, 0.9 for 90%.
utilization 100.0: all three packers were busy at the end.
tasks.pack_order.finished: the orders the task finished.
flows.orders.finished: the orders that left the shop. The flow is named after the arrival that started them, orders. With one task the two counts are equal.
flows.orders.started: the orders that entered the shop, 6,261.
flows.orders.in_system: the 11 orders still in the shop when the hour ended. tasks.pack_order.in_progress gives the same 11.
The names use the spelling utilization, and the text uses "utilisation" for the same thing. The mean wait is 1.38 seconds, over the orders that started packing in this one run with the seed 42. End Conditions shows what a run leaves out when it ends.
Counts and Averages Over Time
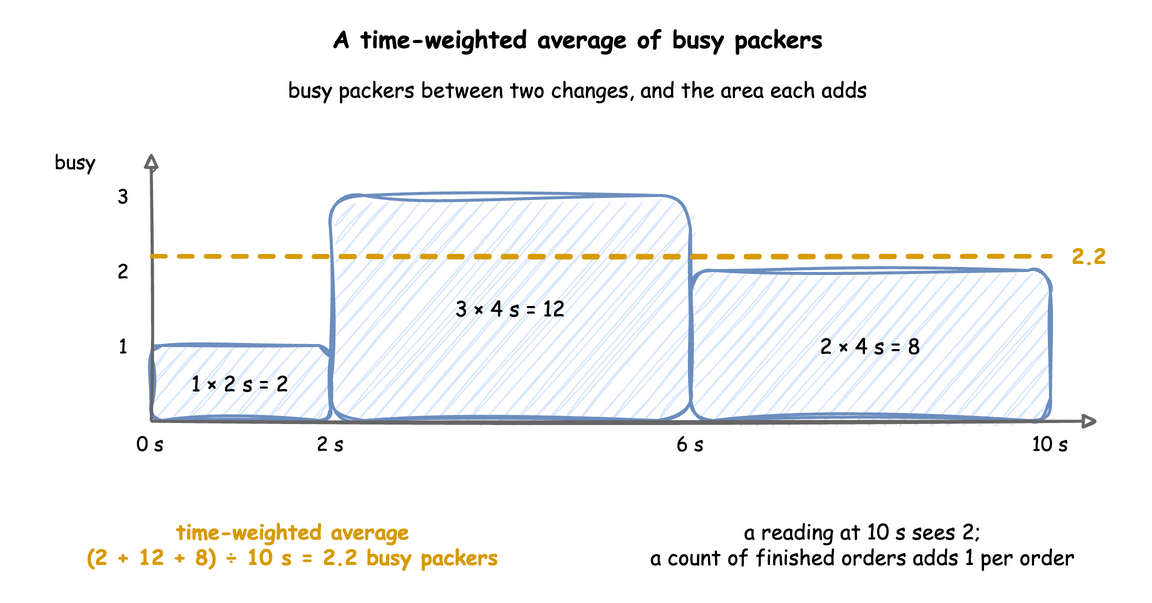
The statistics are of two kinds. A count, such as finished, adds one for each order. An average over time, also called a time-weighted average, such as utilization_avg or queue_length_avg, weighs each value by how long it lasted. Look at the area under the number of busy packers:
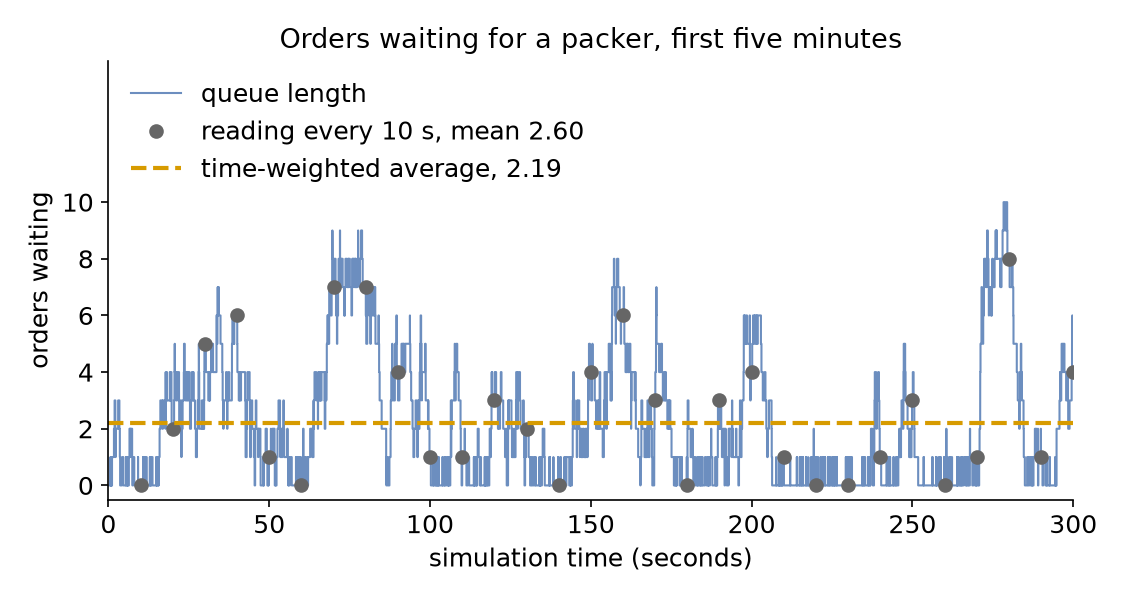
desflow adds the area every time the value changes, so the average is exact at any moment. A reading taken now and then, such as every 10 seconds, sees only the value at that instant. The queue in the first five minutes of the hour shows the difference:
The queue rises and falls many times between two readings, and a handful of readings can land on high points by chance. Here the readings average 2.60 orders, while the average over time for the same five minutes is 2.19 orders.
Wait and Service
The time each order spends in the shop has two parts, both measured from the task's own events:
wait runs from queued to started: the time spent waiting for a packer;
service runs from started to the finished event: the time spent being packed.
service_mean is 1.50 seconds and service_max is 2.7 seconds. The 40 measured times have the same mean and the same longest time, so the model draws what it was given. wait_max is 9.38 seconds: one order waited almost seven times as long as the average one.
What You Get and Why
What does a run tell me? One run of the busy hour, with the seed 42, the measured packing times and no warm-up, tells you that:
the packers were busy 86.6% of the time on average;
the queue held 2.41 orders on average;
an order waited 1.38 seconds on average and 9.38 seconds at most;
6,250 orders were packed.
The numbers check each other. Little's Law says that the average number waiting equals the rate at which orders arrive times the average time each waits. 6,250 orders in 3,600 seconds is 1.74 a second, and 1.74 × 1.38 = 2.40, which matches queue_length_avg, 2.41. The utilisation checks the same way: 1.74 orders a second × 1.50 seconds ÷ 3 packers = 0.87. A set of statistics that fails a check like this one points to a mistake in the model or in how it is read, as Checking and Validating explains.
# The Measuring a Run tutorial: the busy hour, with built-in statistics.# Run it with: desflow run measuring_a_run.yamlsimulation:sim_id:Shopfactor:0random_seed:42resources:packers:{current_cap:3, max_cap:10}arrivals:orders:{dist:exponential, rate:1.8, spawn:pack_order}services:# The 40 packing times measured at the bench, in secondspacking:dist:empiricalvalues:[1.5,2.5,2.4,1.2,1.3,1.2,1.8,1.4,2.0,0.7,2.7,1.4,1.9,1.4,1.3,1.8,2.0,1.4,1.4,1.9,1.1,0.8,1.7,1.1,0.7,1.1,1.2,0.9,0.8,1.5,2.1,1.3,1.1,1.7,1.9,1.3,1.8,2.2,1.4,1.1]tasks:pack_order:service:packingresource:packerspayload:{event_type:order_packed}# Counts, time averages, and the mean and maximum wait and service, every 10 sstats:typical# The statistics are telemetry, so every sink receives themegress:-type:Consolerun:until:1 h
"""The Measuring a Run tutorial: the busy hour, with built-in statistics, builder.Three packers, orders at 1.8 a second and the measured packing times. Every record,the statistics included, is printed to the terminal, and the script prints the finalstatistics again at the end."""importloggingfromdesflowimportConsoleEgress,SimulationContextlogging.basicConfig(level=logging.INFO,format="%(levelname)s [%(asctime)s] %(message)s")# The 40 packing times measured at the bench, in secondsMEASURED=[1.5,2.5,2.4,1.2,1.3,1.2,1.8,1.4,2.0,0.7,2.7,1.4,1.9,1.4,1.3,1.8,2.0,1.4,1.4,1.9,1.1,0.8,1.7,1.1,0.7,1.1,1.2,0.9,0.8,1.5,2.1,1.3,1.1,1.7,1.9,1.3,1.8,2.2,1.4,1.1,]# fmt: skipapp=(SimulationContext(sim_id="Shop",factor=0,random_seed=42).add_resource("packers",current_cap=3,max_cap=10).add_arrival("orders",dist="exponential",rate=1.8).add_service("packing",dist="empirical",values=MEASURED)# Counts, time averages, and the mean and maximum wait and service, every 10 s.with_stats("typical").add_egress(ConsoleEgress()))@app.task(service_id="packing",resource_id="packers")defpack_order(task_id:int):return{"event_type":"order_packed"}@app.arrival_loop("orders")deforder_generator(context:SimulationContext):task_id=0whileTrue:order=yieldcontext.wait_for_arrival("orders")context.spawn(pack_order(task_id,entity=order))task_id+=1if__name__=="__main__":app.run(until="1 h")# The statistics are telemetry, so the console printed them; read them here tooforname,valueinapp.env.stats.readings().items():print(f"{name} = {value}")
"""The Measuring a Run tutorial: the busy hour, with built-in statistics, low-level.Three packers, orders at 1.8 a second and the measured packing times. The orderprocess reports each step to the environment's statistics, which publish them astelemetry; the script prints the final statistics again at the end."""importloggingfromdesflowimport(CapacityConfig,ConsoleEgress,DistributionConfig,DynamicRealtimeEnvironment,DynamicResource,Sampler,SimParameter,)logging.basicConfig(level=logging.INFO,format="%(levelname)s [%(asctime)s] %(message)s")# The 40 packing times measured at the bench, in secondsMEASURED=[1.5,2.5,2.4,1.2,1.3,1.2,1.8,1.4,2.0,0.7,2.7,1.4,1.9,1.4,1.3,1.8,2.0,1.4,1.4,1.9,1.1,0.8,1.7,1.1,0.7,1.1,1.2,0.9,0.8,1.5,2.1,1.3,1.1,1.7,1.9,1.3,1.8,2.2,1.4,1.1,]# fmt: skipPARAMS=SimParameter(sim_id="Shop",arrival={"orders":DistributionConfig(dist="exponential",rate=1.8)},service={"packing":DistributionConfig(dist="empirical",values=MEASURED)},resources={"packers":CapacityConfig(current_cap=3,max_cap=10)},)defpack_order(env,sampler,packers,key,task_id):"""One order, which reports each step to the statistics."""path_id="Shop.service.packing"defpublish(value):env.publish_event(key,value,task="pack_order",instance=task_id)publish({"path_id":path_id,"status":"queued"})env.stats.task_queued("pack_order",task_id)withpackers.request()asrequest:yieldrequestpublish({"path_id":path_id,"status":"started"})env.stats.task_started("pack_order",task_id)yieldenv.timeout(sampler.sample(env.registry.get_config(path_id)))publish({"event_type":"order_packed"})env.stats.task_finished("pack_order",task_id)env.stats.flow_finished("orders")# the order leaves the shopdeforder_generator(env,sampler,packers):arrival=env.registry.get_config("Shop.arrival.orders")task_id=0whileTrue:yieldenv.timeout(sampler.sample(arrival))env.stats.flow_started("orders")# the order enters the shopenv.process(pack_order(env,sampler,packers,f"orders-{task_id+1}",task_id))task_id+=1defrun(until=3600,factor=0.0):env=DynamicRealtimeEnvironment(factor=factor)env.registry.register_sim_parameter(PARAMS)env.setup_egress([ConsoleEgress()])# Counts, time averages, and the mean and maximum wait and service, every 10 senv.setup_stats("Shop","typical",interval=10)packers=DynamicResource(env,"Shop","packers")env.process(order_generator(env,Sampler(seed=42),packers))try:env.run(until=until)finally:env.teardown()returnenvif__name__=="__main__":env=run()# The statistics are telemetry, so the console printed them; read them here tooforname,valueinenv.stats.readings().items():print(f"{name} = {value}")