Parameter Sweeps
Comparing Designs found that a fourth packer cuts the busy hour's mean wait from 2.48 to 0.27 seconds over 20 replications of each, at 1.8 orders a second. That rate is an estimate, and demand moves from day to day. This page asks: how much does the answer depend on the arrival rate?
- Decision: whether the choice of a fourth packer holds if demand differs from the estimate.
- Measures: the mean wait of each design at each rate.
- Runs: the busy hour after its 2-minute warm-up, at four arrival rates around the estimate, 20 replications of each design with the same seeds, spawned from 42.
- Assumptions: those of Trusting Results: orders at random at a steady rate, and the 40 packing times measured at the bench.
What You Will Learn
This page shows how to:
- sweep a registry path over several values in an experiment;
- read each design's result at each value;
- check whether a decision holds if an input differs from its estimate.
What You Add
This page adds a sweep to the experiment: a registry path and the values it takes. The model and the two designs are those of Comparing Designs.
Sweep One Input
A sweep runs every variant at every value of its paths. Here that is two variants, three and four packers, at four arrival rates from 1.6 to 1.9 orders a second. That makes 8 designs, each run 20 times with the same 20 seeds:
Changing one input while every other input stays the same is called one-factor sensitivity analysis. It shows how much the answer depends on that input. A sweep with two paths runs every combination of their values, so its size is the product of the list lengths.
Save the files from Full Files in one folder and run the commands there: desflow experiment parameter_sweeps_experiment.yaml, or python parameter_sweeps.py and python parameter_sweeps_low_level.py. Each design's name is its variant followed by its swept value, such as three Shop.arrival.orders.rate=1.9. results.csv and summary.csv have a column for the swept path. The table gives the mean wait of each design over its 20 replications, with the 95% half-width. The row for 1.8 orders a second is the experiment of Comparing Designs, as Busy Hour Figures lists:
| Orders a second | Three packers (s) | Four packers (s) |
|---|---|---|
| 1.6 | 0.97 ± 0.07 | 0.17 ± 0.01 |
| 1.7 | 1.47 ± 0.14 | 0.21 ± 0.01 |
| 1.8 | 2.48 ± 0.32 | 0.27 ± 0.01 |
| 1.9 | 5.55 ± 1.01 | 0.35 ± 0.02 |
What You Get and Why
The mean wait of each design against the arrival rate, with its 95% interval:
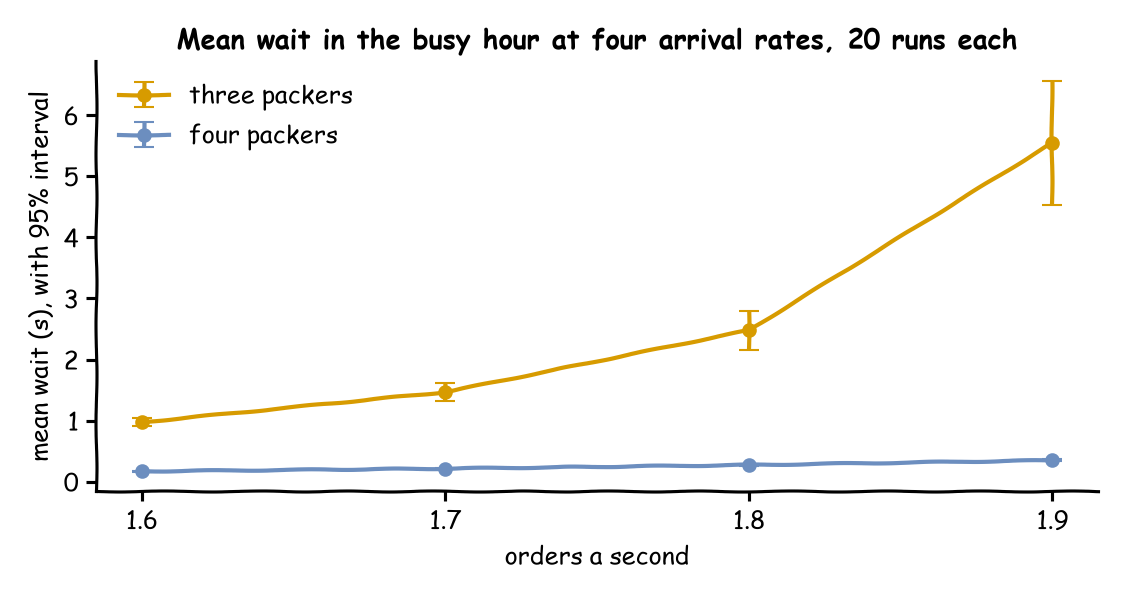
Each point is the mean of 20 replications after the 2-minute warm-up, with seeds spawned from 42, the same for every rate and design. How much does the answer depend on the arrival rate? With three packers, a great deal. A rate of 1.9 orders a second, about 6% above the estimate, more than doubles the mean wait, to 5.55 seconds. A rate of 1.6 orders a second cuts it to 0.97 seconds. With four packers the mean wait stays under 0.35 seconds at every rate. The decision to add a packer therefore holds at every rate in this range. The three-packer wait, on the other hand, cannot be predicted well without a better estimate of the rate.
Three packers that take 1.5 seconds an order on average pack 2 orders a second at most. At 1.9 orders a second they are busy 95% of the time. Close to that limit, a small rise in demand makes the queue much longer, so the wait grows faster than the rate, as Queueing Basics explains. Four packers stay below 72% busy at every rate in the sweep, far from their limit. Every design ran with the same seeds, so the differences between rows come from the rate, not from different random draws. The intervals widen with the rate, because a busier shop varies more from run to run.
Key Takeaways
- A sweep shows how much an answer depends on an input that is only estimated.
- Near full use a small rise in demand makes the wait grow much faster than the demand.
- A decision that holds over the whole range of the sweep does not depend on the exact estimate.
Full Files
Full files
| docs/snippets/tutorials/trusting_results_low_level.py | |
|---|---|
1 2 3 4 5 6 7 8 9 10 11 12 13 14 15 16 17 18 19 20 21 22 23 24 25 26 27 28 29 30 31 32 33 34 35 36 37 38 39 40 41 42 43 44 45 46 47 48 49 50 51 52 53 54 55 56 57 58 59 60 61 62 63 64 65 66 67 68 69 70 71 72 73 74 75 76 77 78 79 80 81 82 83 84 85 86 87 88 89 90 91 92 93 94 95 96 97 98 99 100 101 102 103 104 105 106 107 108 109 110 111 112 113 114 115 116 117 118 119 120 121 122 123 124 125 126 127 128 129 130 131 132 133 134 135 136 137 138 139 140 141 142 143 144 145 146 147 148 | |
Experiments describes every setting of an experiment, its files and its report.