Measuring a Run
Most of the last three pages read one number, the mean wait. A run knows much more: how busy the packers were, how long the queue was, how many orders were packed, and how long the slowest one waited. This page asks: what does a run tell me?
What You Add
stats: typical, the built-in statistics at the level that includes waits. The shop is the busy hour with 3 packers and the measured packing times that Choosing Inputs chose.
Switch On Statistics
desflow keeps statistics about a run as it goes, and publishes them as telemetry every 10 simulation seconds and once more at the end. They are off by default, because most runs only generate data. A level switches them on, and each level answers one more question:
| Level | Question it answers | Adds |
|---|---|---|
none |
nothing (the default) | |
minimal |
What is happening now? | each resource's capacity, in_use, queue_length and utilization |
basic |
How much got done, and how busy was it? | finished counts, and utilization_avg and queue_length_avg over time |
typical |
How long did orders take? | each task's wait_mean, wait_max, service_mean and service_max |
all |
How long did the slowest take? | each task's wait_p50, wait_p95 and wait_p99, and the same for service |
Each level includes the ones above it. Switch on typical:
# Counts, time averages, and the mean and maximum wait and service, every 10 s
env.setup_stats("Shop", "typical", interval=10)
The environment keeps the statistics in env.stats. Resources report their own changes, but a low-level process has no task for desflow to watch, so it reports each step itself: env.stats.task_queued, task_started and task_finished with the task's name and instance id, and flow_finished when the order leaves the shop. The full file below shows them.
The statistics are telemetry, so they reach every sink, and they can also be read in Python at the end of the run:
Every name has the same form, <sim_id>.stats.<kind>.<name>.<statistic>, such as Shop.stats.tasks.pack_order.wait_mean. These are the statistics published at the end of the hour:
[TEL] {'sim_ts': 3600.0, 'timestamp': '...', 'path_id': 'Shop.stats.resources.packers.capacity', 'value': 3}
[TEL] {'sim_ts': 3600.0, 'timestamp': '...', 'path_id': 'Shop.stats.resources.packers.in_use', 'value': 3}
[TEL] {'sim_ts': 3600.0, 'timestamp': '...', 'path_id': 'Shop.stats.resources.packers.queue_length', 'value': 8}
[TEL] {'sim_ts': 3600.0, 'timestamp': '...', 'path_id': 'Shop.stats.resources.packers.utilization', 'value': 100.0}
[TEL] {'sim_ts': 3600.0, 'timestamp': '...', 'path_id': 'Shop.stats.resources.packers.utilization_avg', 'value': 86.56336659179189}
[TEL] {'sim_ts': 3600.0, 'timestamp': '...', 'path_id': 'Shop.stats.resources.packers.queue_length_avg', 'value': 2.405756864104584}
[TEL] {'sim_ts': 3600.0, 'timestamp': '...', 'path_id': 'Shop.stats.tasks.pack_order.finished', 'value': 6250}
[TEL] {'sim_ts': 3600.0, 'timestamp': '...', 'path_id': 'Shop.stats.tasks.pack_order.wait_mean', 'value': 1.3816663590146558}
[TEL] {'sim_ts': 3600.0, 'timestamp': '...', 'path_id': 'Shop.stats.tasks.pack_order.wait_max', 'value': 9.378296391499589}
[TEL] {'sim_ts': 3600.0, 'timestamp': '...', 'path_id': 'Shop.stats.tasks.pack_order.service_mean', 'value': 1.4953759999999972}
[TEL] {'sim_ts': 3600.0, 'timestamp': '...', 'path_id': 'Shop.stats.tasks.pack_order.service_max', 'value': 2.7000000000000455}
[TEL] {'sim_ts': 3600.0, 'timestamp': '...', 'path_id': 'Shop.stats.flows.orders.finished', 'value': 6250}
tasks.pack_order.finished counts the orders the task finished, and flows.orders.finished counts the orders that left the shop, named by the arrival that started them; with one task the two are equal. The mean wait is 1.38 seconds, not the 1.35 seconds of the empirical candidate in Choosing Inputs, although the times are the same 40. The service is now called packing, so it draws from its own stream, service.packing, and the times come in another order; Randomness and Seeds explains why.
Counts and Averages Over Time
The statistics are of two kinds. A count, such as finished, adds one for each order. An average over time, such as utilization_avg or queue_length_avg, weighs each value by how long it lasted. Look at the area under the number of busy packers:
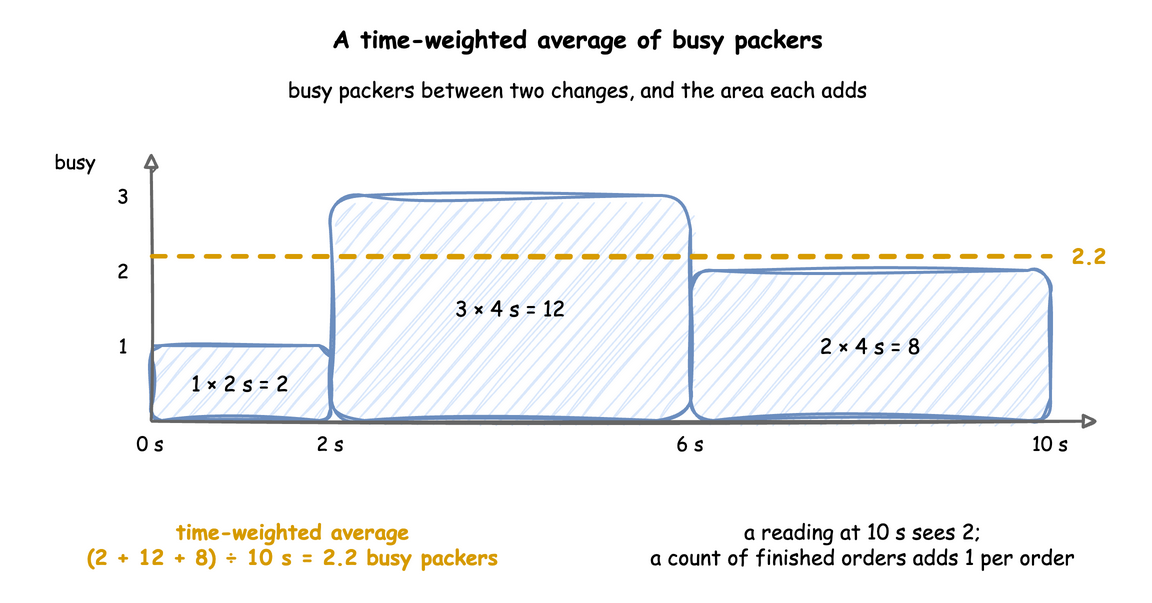
desflow adds the area every time the value changes, so the average is exact at any moment. A reading taken now and then, such as every 10 seconds, sees only the value at that instant. The queue in the first five minutes of the hour shows the difference:
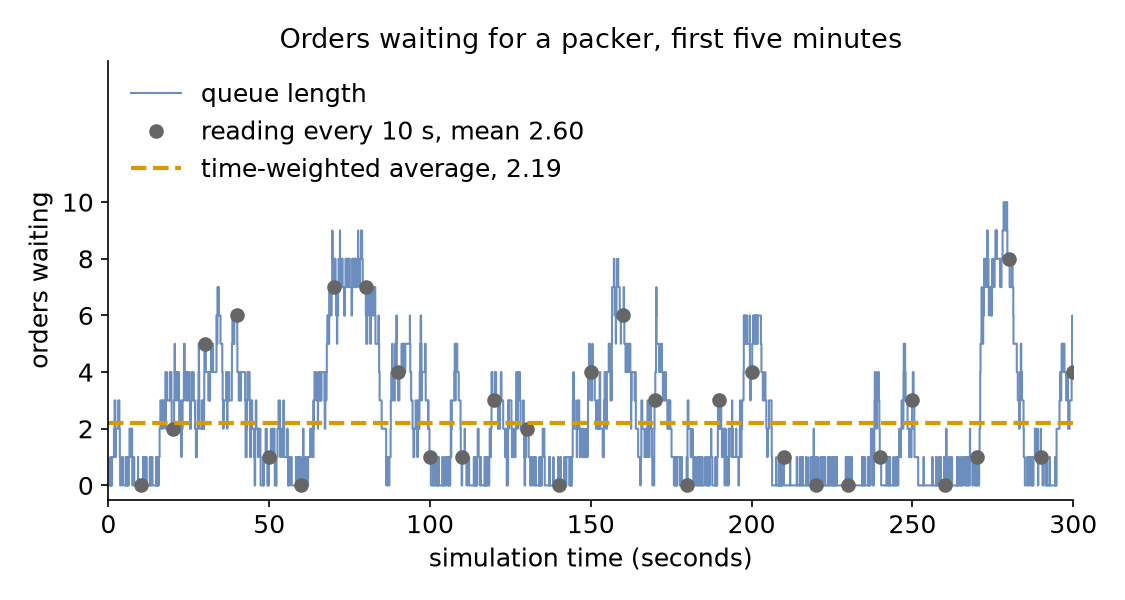
The queue rises and falls many times between two readings, and a handful of readings can land on high points by chance. Here they average 2.60 orders, while the queue held 2.19 orders on average over the same five minutes.
Wait and Service
The time each order spends in the shop has two parts, both measured from the task's own events:
- wait runs from
queuedtostarted: the time spent waiting for a packer; - service runs from
startedto the finished event: the time spent being packed.
service_mean is 1.50 seconds, the mean of the measured times, and service_max is 2.7 seconds, the longest of them, so the model draws what it was given. wait_max is 9.38 seconds: one order waited almost seven times as long as the average one.
Result
What does a run tell me? One hour of the busy shop tells you that the packers were busy 86.6% of the time on average, the queue held 2.41 orders on average, an order waited 1.38 seconds on average and 9.38 seconds at most, and 6,250 orders were packed.
Why It Works
The numbers check each other. Little's Law says that the average number waiting equals the rate at which orders arrive times the average time each waits. 6,250 orders in 3,600 seconds is 1.74 a second, and 1.74 × 1.38 = 2.40, which is queue_length_avg. The utilisation checks the same way: 1.74 orders a second × 1.50 seconds ÷ 3 packers = 0.87. A set of statistics that fails a check like this one points to a mistake in the model or in how it is read. Statistics describes how each one is computed, and the Statistics reference lists every name each level publishes.
Full Files
Full files
# The Measuring a Run tutorial: the busy hour, with built-in statistics.
# Run it with: desflow run measuring_a_run.yaml
simulation:
sim_id: Shop
factor: 0
random_seed: 42
resources:
packers: {current_cap: 3, max_cap: 10}
arrivals:
orders: {dist: exponential, rate: 1.8, spawn: pack_order}
services:
# The 40 packing times measured at the bench, in seconds
packing:
dist: empirical
values: [1.5, 2.5, 2.4, 1.2, 1.3, 1.2, 1.8, 1.4, 2.0, 0.7,
2.7, 1.4, 1.9, 1.4, 1.3, 1.8, 2.0, 1.4, 1.4, 1.9,
1.1, 0.8, 1.7, 1.1, 0.7, 1.1, 1.2, 0.9, 0.8, 1.5,
2.1, 1.3, 1.1, 1.7, 1.9, 1.3, 1.8, 2.2, 1.4, 1.1]
tasks:
pack_order:
service: packing
resource: packers
payload: {event_type: order_packed}
# Counts, time averages, and the mean and maximum wait and service, every 10 s
stats: typical
# The statistics are telemetry, so every sink receives them
egress:
- type: Console
run:
until: 1 h
"""The Measuring a Run tutorial: the busy hour, with built-in statistics, builder.
Three packers, orders at 1.8 a second and the measured packing times. Every record,
the statistics included, is printed to the terminal, and the script prints the final
statistics again at the end.
"""
import logging
from desflow import ConsoleEgress, SimulationContext
logging.basicConfig(
level=logging.INFO, format="%(levelname)s [%(asctime)s] %(message)s"
)
# The 40 packing times measured at the bench, in seconds
MEASURED = [
1.5, 2.5, 2.4, 1.2, 1.3, 1.2, 1.8, 1.4, 2.0, 0.7,
2.7, 1.4, 1.9, 1.4, 1.3, 1.8, 2.0, 1.4, 1.4, 1.9,
1.1, 0.8, 1.7, 1.1, 0.7, 1.1, 1.2, 0.9, 0.8, 1.5,
2.1, 1.3, 1.1, 1.7, 1.9, 1.3, 1.8, 2.2, 1.4, 1.1,
] # fmt: skip
app = (
SimulationContext(sim_id="Shop", factor=0, random_seed=42)
.add_resource("packers", current_cap=3, max_cap=10)
.add_arrival("orders", dist="exponential", rate=1.8)
.add_service("packing", dist="empirical", values=MEASURED)
# Counts, time averages, and the mean and maximum wait and service, every 10 s
.with_stats("typical")
.add_egress(ConsoleEgress())
)
@app.task(service_id="packing", resource_id="packers")
def pack_order(task_id: int):
return {"event_type": "order_packed"}
@app.arrival_loop("orders")
def order_generator(context: SimulationContext):
task_id = 0
while True:
order = yield context.wait_for_arrival("orders")
context.spawn(pack_order(task_id, entity=order))
task_id += 1
if __name__ == "__main__":
app.run(until="1 h")
# The statistics are telemetry, so the console printed them; read them here too
for name, value in app.env.stats.readings().items():
print(f"{name} = {value}")
"""The Measuring a Run tutorial: the busy hour, with built-in statistics, low-level.
Three packers, orders at 1.8 a second and the measured packing times. The order
process reports each step to the environment's statistics, which publish them as
telemetry; the script prints the final statistics again at the end.
"""
import logging
from desflow import (
CapacityConfig,
ConsoleEgress,
DistributionConfig,
DynamicRealtimeEnvironment,
DynamicResource,
Sampler,
SimParameter,
)
logging.basicConfig(
level=logging.INFO, format="%(levelname)s [%(asctime)s] %(message)s"
)
# The 40 packing times measured at the bench, in seconds
MEASURED = [
1.5, 2.5, 2.4, 1.2, 1.3, 1.2, 1.8, 1.4, 2.0, 0.7,
2.7, 1.4, 1.9, 1.4, 1.3, 1.8, 2.0, 1.4, 1.4, 1.9,
1.1, 0.8, 1.7, 1.1, 0.7, 1.1, 1.2, 0.9, 0.8, 1.5,
2.1, 1.3, 1.1, 1.7, 1.9, 1.3, 1.8, 2.2, 1.4, 1.1,
] # fmt: skip
PARAMS = SimParameter(
sim_id="Shop",
arrival={"orders": DistributionConfig(dist="exponential", rate=1.8)},
service={"packing": DistributionConfig(dist="empirical", values=MEASURED)},
resources={"packers": CapacityConfig(current_cap=3, max_cap=10)},
)
def pack_order(env, sampler, packers, key, task_id):
"""One order, which reports each step to the statistics."""
path_id = "Shop.service.packing"
def publish(value):
env.publish_event(key, value, task="pack_order", instance=task_id)
publish({"path_id": path_id, "status": "queued"})
env.stats.task_queued("pack_order", task_id)
with packers.request() as request:
yield request
publish({"path_id": path_id, "status": "started"})
env.stats.task_started("pack_order", task_id)
yield env.timeout(sampler.sample(env.registry.get_config(path_id)))
publish({"event_type": "order_packed"})
env.stats.task_finished("pack_order", task_id)
env.stats.flow_finished("orders") # the order leaves the shop
def order_generator(env, sampler, packers):
arrival = env.registry.get_config("Shop.arrival.orders")
task_id = 0
while True:
yield env.timeout(sampler.sample(arrival))
env.process(pack_order(env, sampler, packers, f"orders-{task_id + 1}", task_id))
task_id += 1
def run(until=3600, factor=0.0):
env = DynamicRealtimeEnvironment(factor=factor)
env.registry.register_sim_parameter(PARAMS)
env.setup_egress([ConsoleEgress()])
# Counts, time averages, and the mean and maximum wait and service, every 10 s
env.setup_stats("Shop", "typical", interval=10)
packers = DynamicResource(env, "Shop", "packers")
env.process(order_generator(env, Sampler(seed=42), packers))
try:
env.run(until=until)
finally:
env.teardown()
return env
if __name__ == "__main__":
    env = run()
    # The statistics are telemetry, so the console printed them; read them here too
    for name, value in env.stats.readings().items():
        print(f"{name} = {value}")
Next, Trusting Results asks whether one run is enough.