Evidently reports
The evidently profile runs the Evidently UI and API. It keeps projects, reports, dashboards and datasets in the evidently database on PostgreSQL. The client computes each report and pushes the result. The code below comes from the end-to-end tests.
The server runs Evidently 0.7.23, so install the same client version. The UI is at http://127.0.0.1:8089, with no login.
Push a data drift report
import numpy as np, pandas as pd
from evidently import Report
from evidently.presets import DataDriftPreset
from evidently.ui.workspace import RemoteWorkspace

ws = RemoteWorkspace("http://127.0.0.1:8089")
project = ws.create_project("demo")

rng = np.random.default_rng(7)
reference = pd.DataFrame({"x": rng.normal(0, 1, 500), "y": rng.normal(0, 1, 500)})
current = pd.DataFrame({"x": rng.normal(3, 1, 500), "y": rng.normal(0, 1, 500)})

snapshot = Report([DataDriftPreset()]).run(current_data=current, reference_data=reference)
ws.add_run(project.id, snapshot)
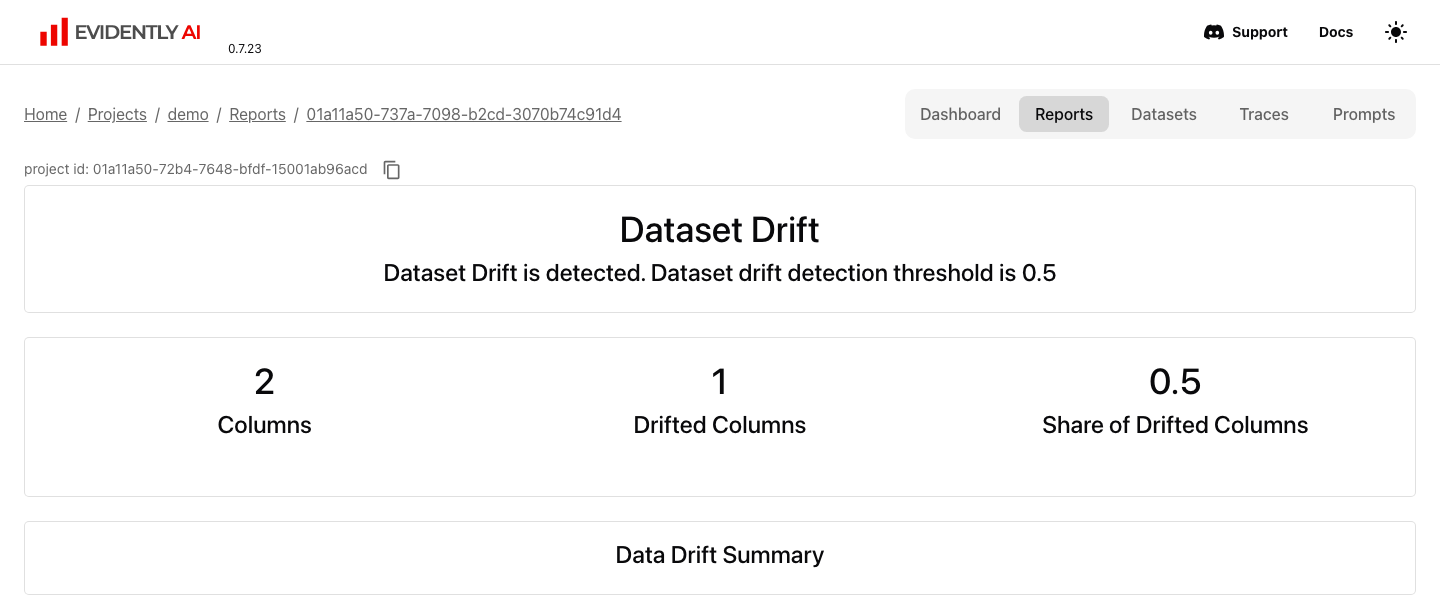
Column x moves by three standard deviations and y does not, so the report in the UI shows one drifted column.
Open the report under the project's Reports tab:
Store a dataset
from evidently import DataDefinition, Dataset

data = pd.DataFrame({"id": [1, 2, 3], "score": [0.1, 0.5, 0.9]})
dataset_id = ws.add_dataset(project.id, Dataset.from_pandas(data, data_definition=DataDefinition()), "demo")
ws.load_dataset(dataset_id).as_dataframe()
The dataset is stored in the evidently database, with the projects and reports.
From Airflow or another container
Inside the odctl network, connect with RemoteWorkspace("http://evidently:8000"). For Airflow tasks, set _AIRFLOW_PIP_DEPS="evidently==0.7.23" in .odctl/.env and run odctl recreate airflow. The server's settings are in evidently/config.yaml in the workspace.