Telemetry
The telemetry profile runs the grafana/otel-lgtm image: an OpenTelemetry Collector, Prometheus, Tempo, Loki and Grafana in one container. Start it next to the profiles you want to watch:
| Endpoint | Address |
|---|---|
Grafana (user user, password password) |
http://127.0.0.1:3004 |
| Prometheus | http://127.0.0.1:19090 |
| OTLP through the collector | 127.0.0.1:4317 (gRPC), http://127.0.0.1:4318 (HTTP) |
Where the metrics come from
Prometheus scrapes the services that publish a metrics endpoint, by container name on the odctl network. Airflow pushes its metrics over OTLP to the collector, and the collector reads PostgreSQL and Valkey directly. A service that is not running is simply a target that is down.
Dashboards
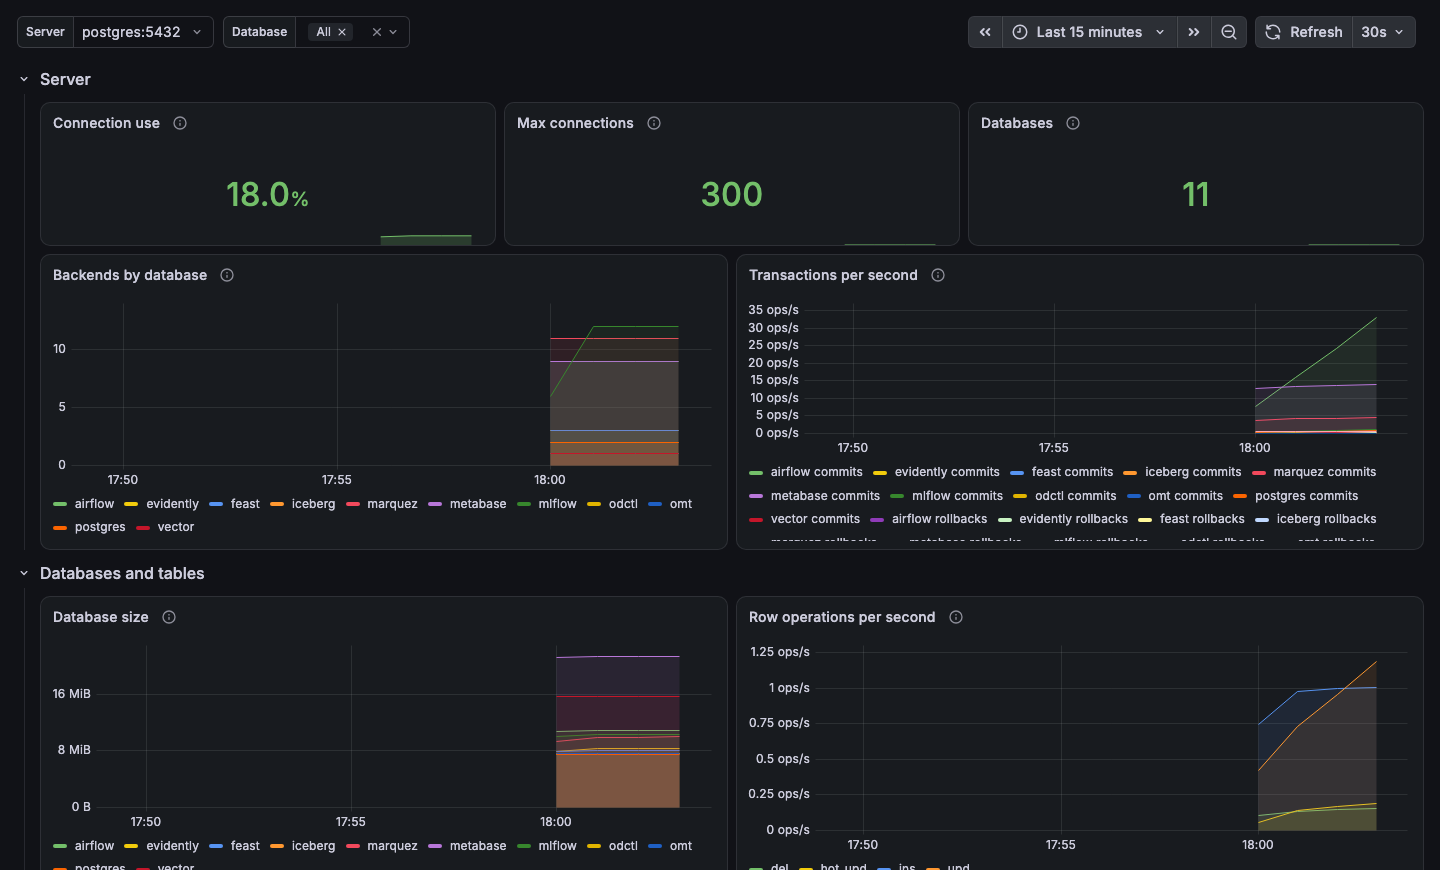
Grafana has a dashboard per service in a folder named odctl. A dashboard fills in once its service's profile is up. The dashboards are JSON files in .odctl/grafana/dashboards/. Edit a file and run odctl restart telemetry to load it. Changes made in the Grafana UI are not kept.
For example, the PostgreSQL dashboard:
Send your own metrics
Point an OpenTelemetry SDK at http://127.0.0.1:4318, its default HTTP port. The end-to-end tests post one metric with curl, which shows the path:
ts=$(python3 -c "import time;print(int(time.time()*1e9))")
cat > /tmp/otlp.json <<JSON
{"resourceMetrics":[{"resource":{"attributes":[{"key":"service.name","value":{"stringValue":"demo"}}]},
"scopeMetrics":[{"scope":{"name":"demo"},"metrics":[{"name":"demo_total","unit":"1",
"sum":{"aggregationTemporality":2,"isMonotonic":true,"dataPoints":[
{"asDouble":42,"timeUnixNano":"${ts}","startTimeUnixNano":"${ts}","attributes":[]}]}}]}]}]}
JSON
curl -X POST -H "Content-Type: application/json" --data-binary @/tmp/otlp.json \
  http://127.0.0.1:4318/v1/metrics
curl "http://127.0.0.1:19090/api/v1/query?query=demo_total"
Prometheus also accepts OTLP metrics directly at http://127.0.0.1:19090/api/v1/otlp/v1/metrics.